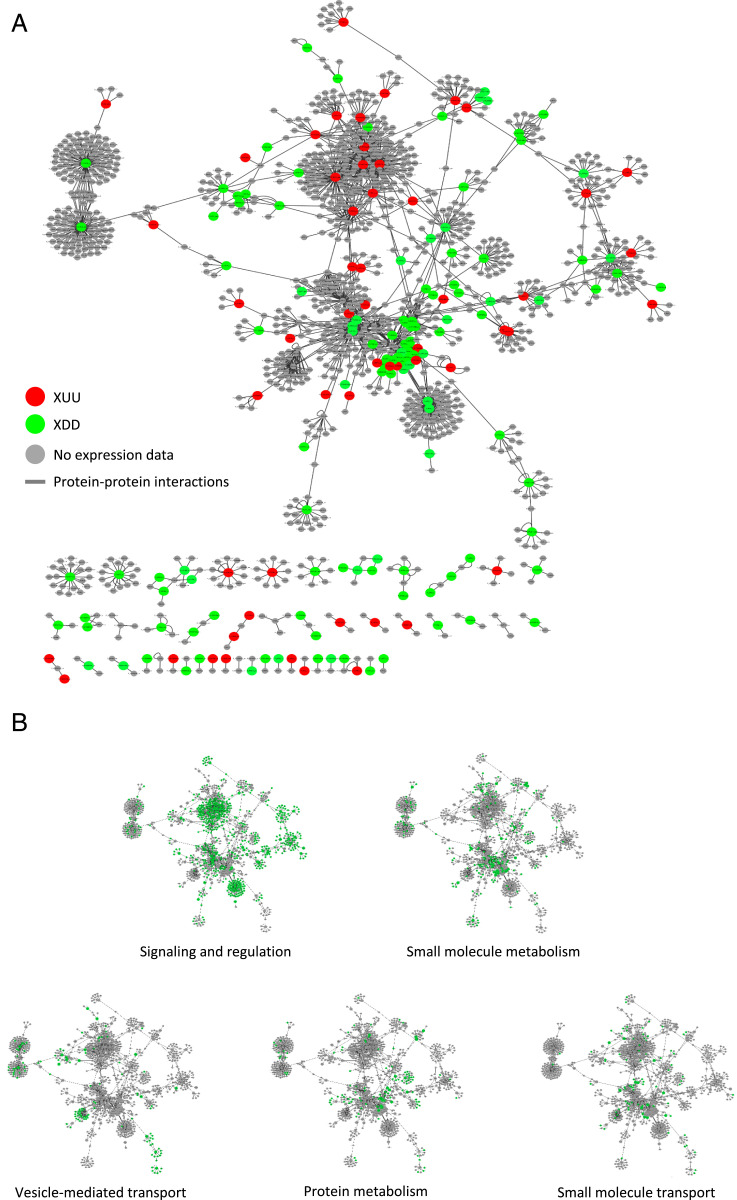
Fig. 4.
Expression profiles and functions of components of the RKS1 protein–protein interaction network. (A) The RKS1 protein–protein interaction network plotted with Cytoscape showing the components for which the gene expression pattern has been evaluated: in red, XDD DEGs (classes UDD and ØDD); in green, XUU DEGs (classes DUU and ØUU). (B) Display on the RKS1 protein–protein interaction network of the functional annotation of the different proteins. In green are proteins assigned to the functional group indicated.

