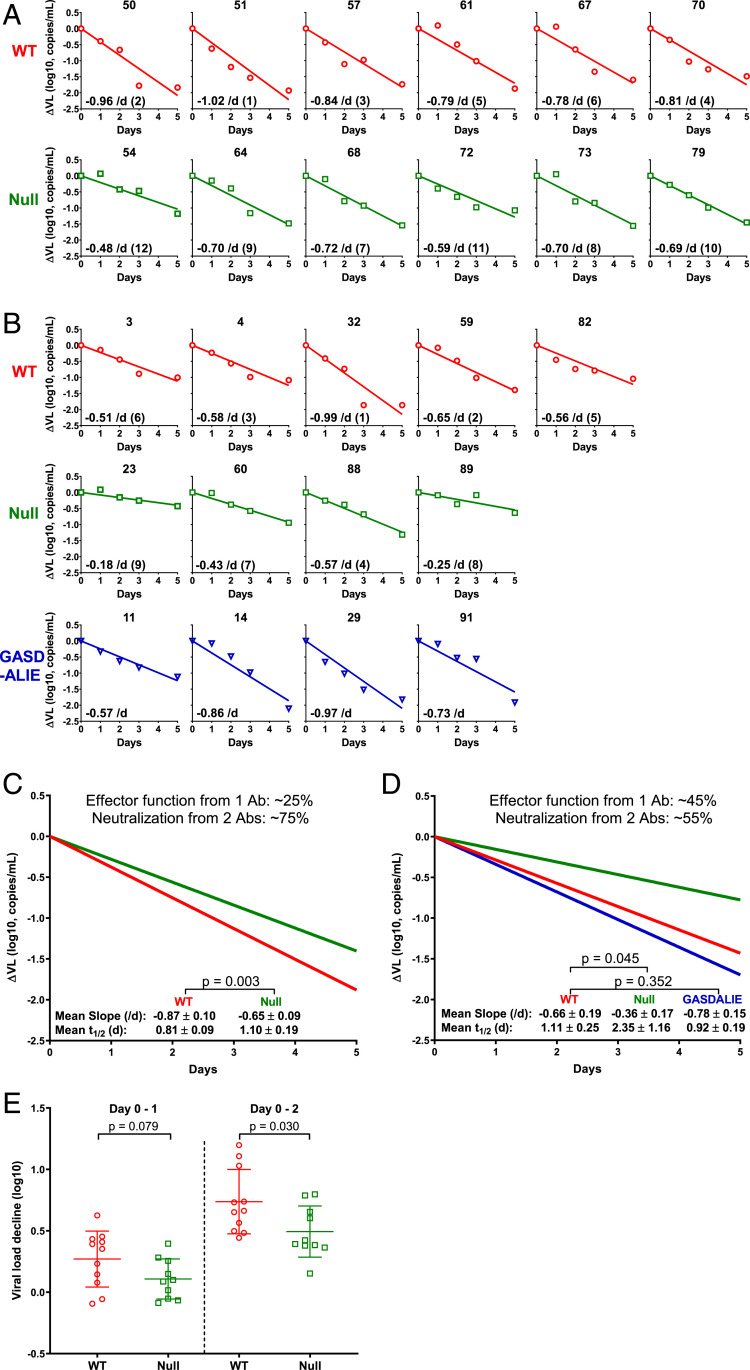
Fig. 1.
Measuring and analyzing the decline in plasma viral load in HIV-1-infected humanized mice following administration of 117/1,400 variants. (A and B) HIV-1JR-CSF-infected humanized mice were treated with 117/1,400-WT (red), 117/1,400-Null (green), or 117/1,400-GASDALIE (blue). Plasma ΔVL is shown for each individual mouse. The decay slope (per day), calculated on a natural log scale, is also shown as an Inset in each panel followed by the rank order for the decay slopes in parentheses (1 being the largest and 12 being the smallest, comparing WT to Null only). (C and D) Mean decay slopes for the WT group (red) and Null group (green) in the first (C) and second (D) experiments with the latter also showing the mean decay slope for the GASDALIE group (blue). The relative contribution of Fc-mediated effector functions was computed as the difference in slope between WT and Null divided by the WT slope. (E) Magnitude of plasma ΔVL from both mouse experiments combined from day 0–1 and day 0–2 postantibody treatment. Lines represent mean ± SD, and P values were calculated by a two-tailed t test.

