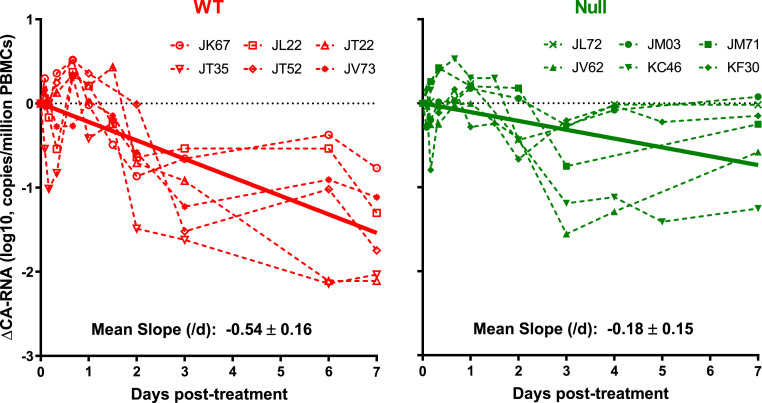
Fig. 3.
Measuring and analyzing the decline in cell-associated SHIV RNA in serial PBMC samples from macaques treated with 117/1,400-WT (red) or 117/1,400-Null (green). Each dashed line represents the changes measured in an animal, whereas the dark solid lines represent the best-fit line from linear regression analysis of all of the data for each group. The mean slopes, calculated on a natural log scale for these two best-fit lines, are significantly different (−0.54/d versus −0.18/d) with a P value of 0.004.

