Fig. 2.
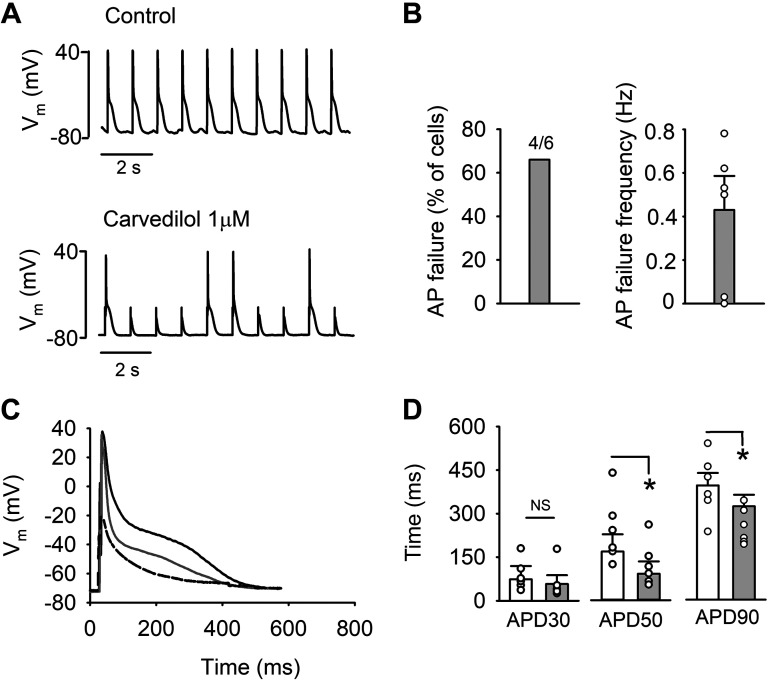
Action potential (AP) failure by carvedilol. A: representative AP traces in control (top) and after carvedilol (1 µM) exposure (bottom). APs were recorded in current-clamp mode and evoked by 5-ms stimulation pulses of a magnitude ∼1.5 times higher than AP activation threshold. B: summary of AP failure in percentage of cells (left) and AP failure frequency (right) after carvedilol treatment. C: representative traces of AP waveform in control (black), after carvedilol exposure (gray), and AP failure (dashed). D: average AP duration (APD) at 30, 50, and 90% repolarization (APD30, APD50, and APD90, respectively; n = 6) in control (white bars) and in presence of carvedilol (gray bars). AP failures are not included in APD calculations. *P < 0.05 (paired t-test). Vm, membrane potential; NS, not significant.

