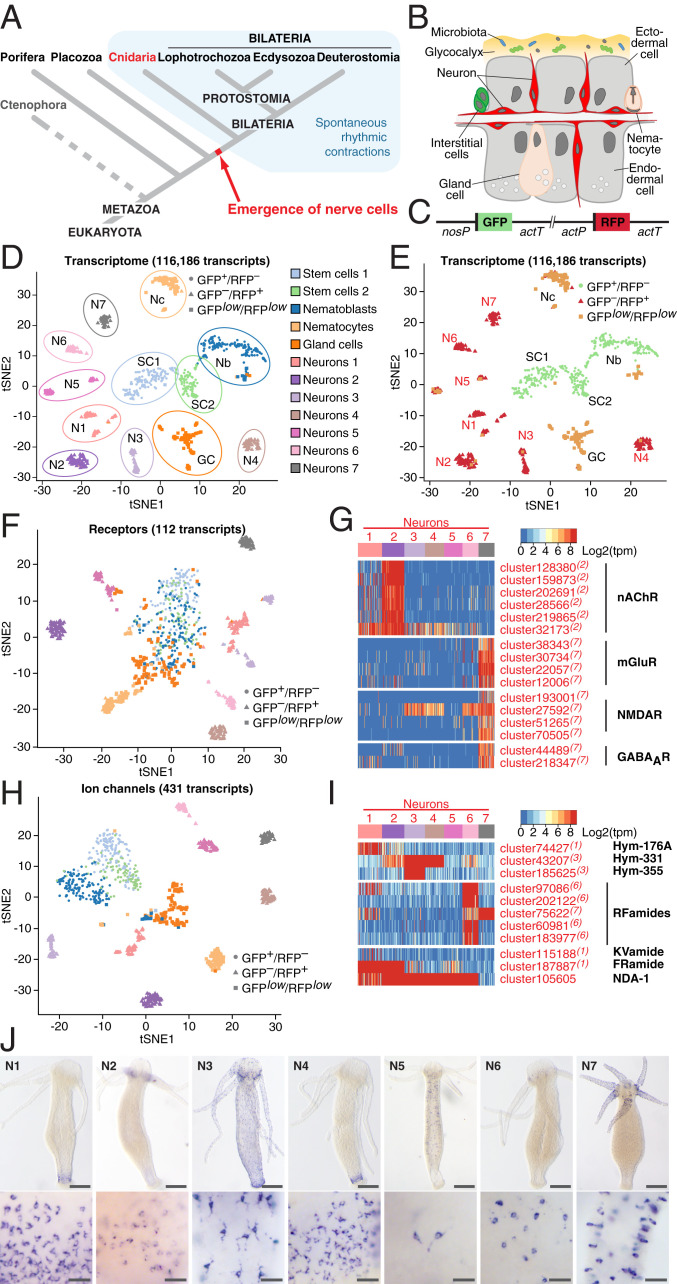
Fig. 1.
Single-cell transcriptome profiling uncovers the molecular anatomy of Hydra nervous system. (A) Emergence of the first nerve cells preceded the divergence of Cnidaria and Bilateria. Cnidarians possess structurally simple nervous systems and offer a great potential to reveal the fundamental structural and functional principles of neural circuits. Spontaneous rhythmic contractions are ubiquitously observed in Eumetazoa. (B) The Hydra body is made of three cell lineages: The ectodermal and endodermal epithelia separated by the extracellular matrix and the lineage of interstitial cells. The outer surface of the ectoderm is covered by a glycocalyx that serves as a habitat for symbiotic bacteria. The endoderm lining the gastric cavity is free of glycocalyx and stable microbiota. Two nerve nets made of sensory and ganglion neurons are embedded within both epithelia. (C) Genetic construct used to generate transgenic Hydra polyps and differentially label cells within the interstitial lineage by a combination of two fluorescent proteins: GFP expressed under a stem cell-specific nanos promoter (nosP), and RFP driven by the actin promoter (actP) active in terminally differentiated neurons. Both cassettes are flanked by the actin terminator (actT). (D) t-Distributed stochastic neighbor embedding (t-SNE) map constructed by dimensionality-reduction principal component analysis defined by highly covariable genes (Materials and Methods). A total of 928 cells were partitioned in 12 clusters and colored by their cell-type identities inferred from expressed proliferation and cell-type–specific marker genes (Datasets S5 and S6). (E) t-SNE map based on analysis of the entire transcriptome made of 116,186 transcripts segregates 12 clusters, including 7 subpopulations of neurons. Cells are color-coded by their phenotype captured by FACS upon sorting. (F) t-SNE map based on expression analysis of 112 transcripts coding for putative neurotransmitter receptors (Dataset S7). Seven neuronal populations are clearly segregated, indicating that each neuronal population is characterized by a specific set of receptors. (G) Heatmap illustrating expression of genes coding for putative nAChR, mGluR and NMDAR, and GABAAR within seven neuronal populations. Expression within the entire interstitial lineage is presented in SI Appendix, Fig. S3. Transcripts specifically up-regulated in the neurons are labeled red; superscript numbers indicate the nerve cell cluster (N1–N7) where the transcripts are significantly (adjusted P < 0.05) enriched. (H) t-SNE map constructed by expression analysis of 431 transcripts coding for putative ion channels (Dataset S8). Seven neuronal populations are clearly segregated, suggesting that each neuronal population is characterized by a specific set of channels. (I) Heatmap illustrates expression of 11 genes coding for main known neuropeptides in Hydra. Each neuronal population expresses a unique combination of neuropeptides. (J) In situ hybridization for marker genes strongly enriched in each of seven nerve cells clusters (N1–N7) (SI Appendix, Fig. S6) reveals that seven neuronal subpopulations reside in spatially restricted domains along the body column of Hydra (Scale bars, 100 µm upper panel, 25 µm lower panel.)

