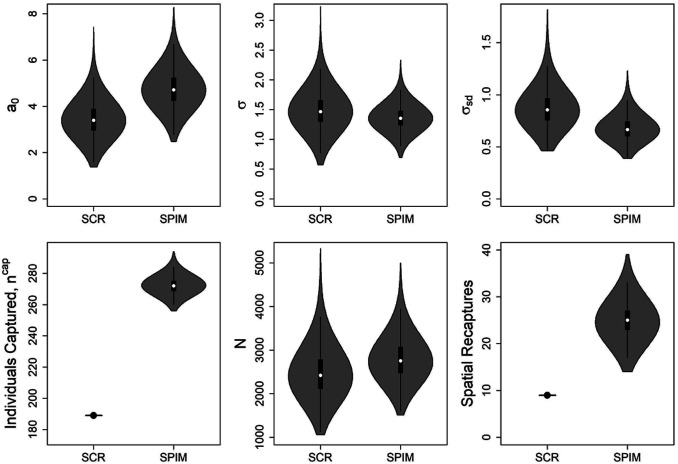
Fig. 3.
SCR process and observation model posterior distributions from the SCR and SPIM analyses of the fisher dataset. is the overall detection parameter, is the population-level detection function spatial-scale parameter in kilometers, is the SD of the individual-level variance in the spatial-scale parameter, is the number of individuals captured, and is the population abundance. The number of captured individuals and spatial recaptures in the SCR analysis are known statistics.

