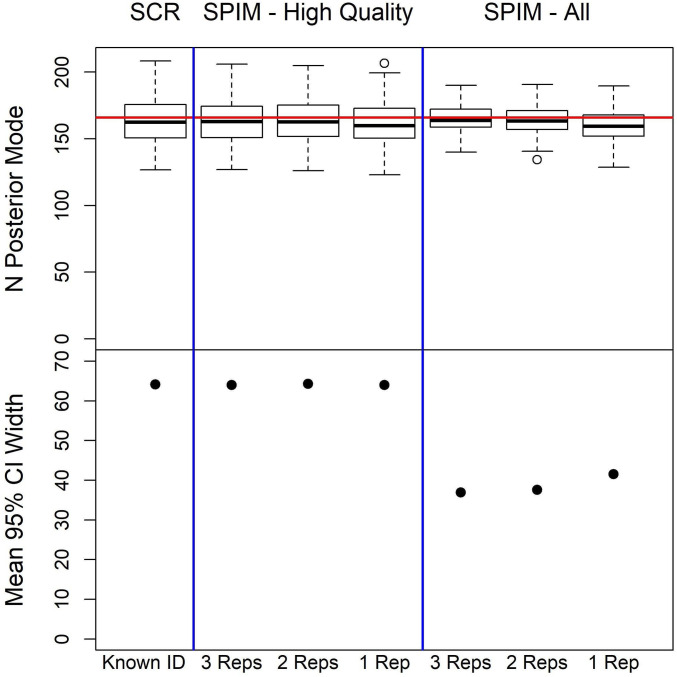
Fig. 4.
Plots of simulation study results for the estimation of abundance. Top row displays boxplots of the posterior modes for abundance (simulated value is 166), showing estimator accuracy, and Bottom row displays the mean 95% CI width, a measure of estimator precision. The estimators from Left to Right are the SCR estimator using only certain identity samples; followed by the gSPIM estimators using only the high-quality samples with three, two, and one replicated assignments; followed by the gSPIM estimators using both high- and low-quality samples with three, two, and one replicated assignments.

