Fig. 3.
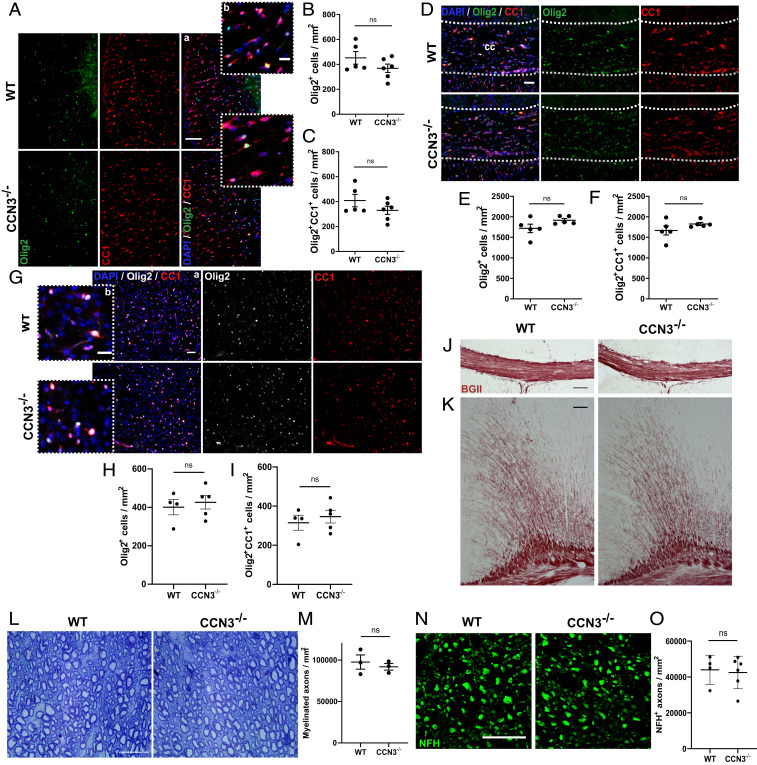
CCN3 is not required for CNS myelination in vivo. Representative images of Olig2 and CC1 staining in spinal cord vWM (A), medial corpus callosum (D), and motor cortex (G). OLC (B) and differentiated oligodendrocyte quantification (C) in spinal cord vWM. OLC (E) and differentiated oligodendrocyte quantification (F) in the medial corpus callosum. OLC (H) and differentiated oligodendrocyte quantification (I) in motor cortex. Representative images of Black Gold II myelin staining in medial corpus callosum (J) and motor cortex (K). (L) Representative images of toluidine blue staining of semithin spinal cord vWM sections. (M) Myelinated axon quantification in spinal cord vWM. (N) Representative images of NFH staining in spinal cord vWM. (O) Axonal quantification in spinal cord vWM. (Scale bars: 100 µm [A, a; J; and K], 50 µm [G, a and D], and 25 µm [A, b; G, b; L; and N].) Data are mean ± SEM. ns, not significant. Statistical analysis: (B, C, E, F, H, I, M, O) unpaired, two-tailed, Student’s t tests. n = 4–6 (B, C, E, F, H, I, and O) and 3 (M) animals per group.

