Fig. 4.
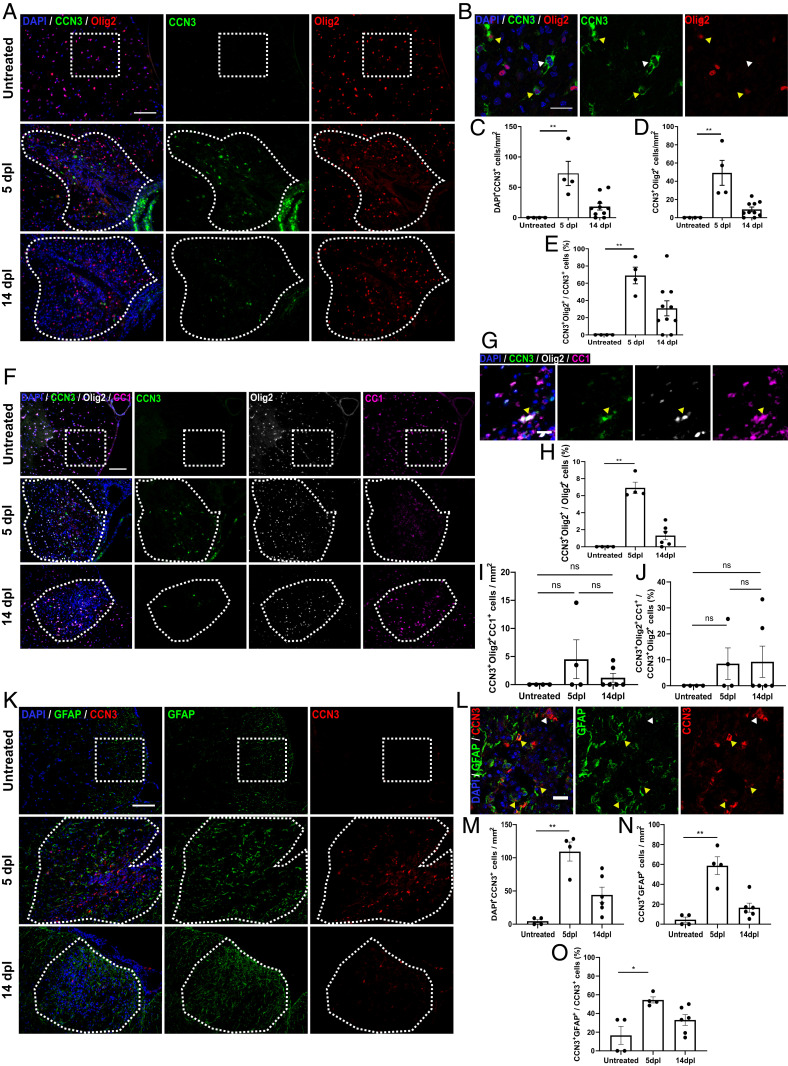
CCN3 is transiently up-regulated in the spinal cord during remyelination. Representative images of CCN3 and Olig2 (A), CCN3, Olig2 and CC1 (F), and CCN3 and GFAP (K) staining in spinal cord of untreated controls, and 5 and 14 dpl after lysolecithin injection. (B) Representative confocal images of CCN3 and Olig2 staining in spinal cord lesions at 5 dpl. White arrowheads, CCN3+Olig2− cells; yellow arrowheads, CCN3+Olig2+ cells. CCN3+ cells (C), CCN3+Olig2+ cells (D), and percentage of CCN3+Olig2+ cells (E) quantification in untreated, 5 dpl, and 14 dpl spinal cord vWM. (G) Representative images of CCN3, Olig2, and CC1 staining in spinal cord lesions at 5 dpl. Yellow arrowheads, CCN3+Olig2+CC1+ cell. Proportion of OLCs that are CCN3+ (H), CCN3+Olig2+CC1+ cells (I) and proportion of CCN3-expressing OLCs that are CC1+ (J) quantification in untreated, 5 dpl, and 14 dpl spinal cord vWM. (L) Representative confocal images of CCN3 and GFAP staining in spinal cord lesions at 5 dpl. White arrowheads, CCN3+GFAP− cells; yellow arrowheads, CCN3+GFAP+ cells. CCN3+ cells (M), CCN3+GFAP+ cells (N), and percentage of CCN3+GFAP+ cell quantification (O) in untreated, 5 dpl, and 14 dpl spinal cord vWM. (Scale bars: F and K, 100 µm; A, 50 µm; B, G, and L, 25 µm.) Data are mean ± SEM. ns, not significant; *P < 0.05; **P < 0.01. Statistical analysis: Kruskal–Wallis with Dunn’s Multiple Comparison test. n = 4–10 animals per group.

