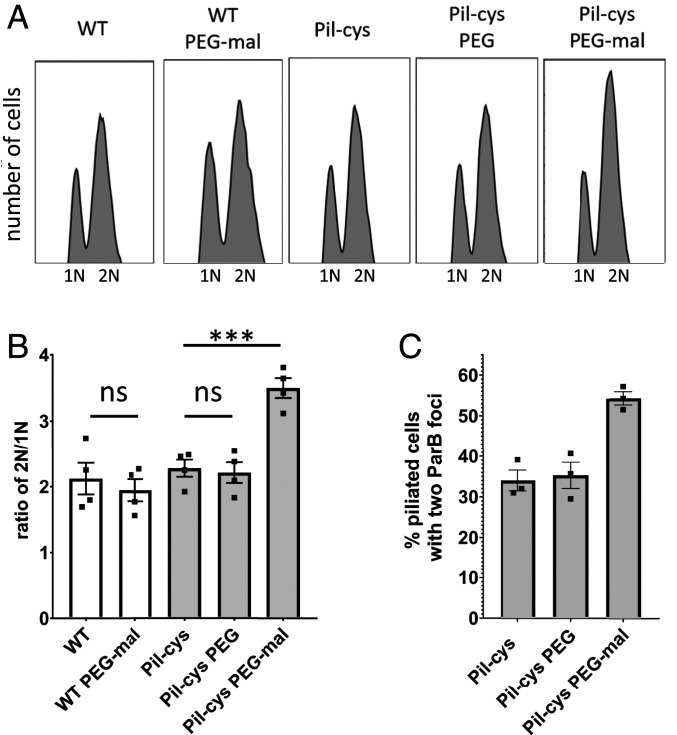
Fig. 1.
Obstruction of pilus retraction stimulates DNA replication initiation. (A) Representative flow cytometry plots showing chromosome content of cells quantified in B. (B) Ratio of cells with two chromosomes to cells with one chromosome determined by flow cytometry analysis of genomic content. Bar graph shows the mean ± SEM of three independent biological replicates. Flow cytometry experiments were performed with holdfast synthesis mutants to prevent cell–cell aggregation. (C) Quantification of the percent of piliated cells with two ParB-mCherry foci. Maleimide-positive cells were labeled as “piliated” as the fluorophore entered the cells via pilus retraction. Bar graph shows the mean ± SEM of three independent biological replicates. A minimum of 100 cells was quantified for each replicate. Statistical comparisons were made using Sidak’s multiple-comparisons test. ***P < 0.001; ns, not significant.

