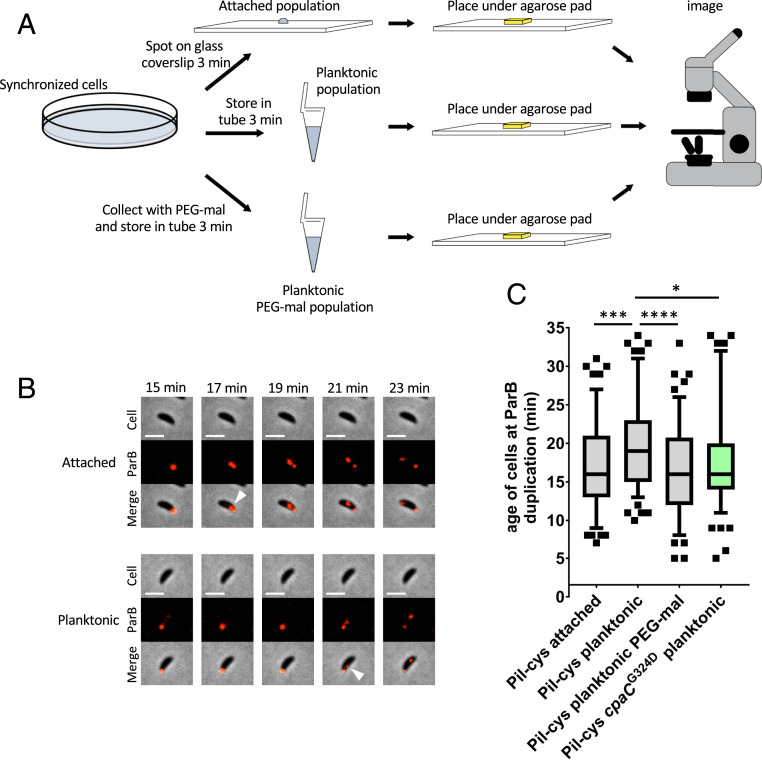
Fig. 3.
Surface contact stimulates cell-cycle progression. (A) Schematic of experimental setup. (B) Representative time-lapse images of data shown in C. (Scale bars, 2 µm.) White arrowheads indicate ParB duplication event. (C) Box and whisker plots show 5 to 95% CI. Data are compiled from four independent biological replicates (n = 30 cells per replicate). Statistical comparisons were made using Sidak’s multiple-comparisons test. *P < 0.05, ***P < 0.001, ****P < 0.0001.

