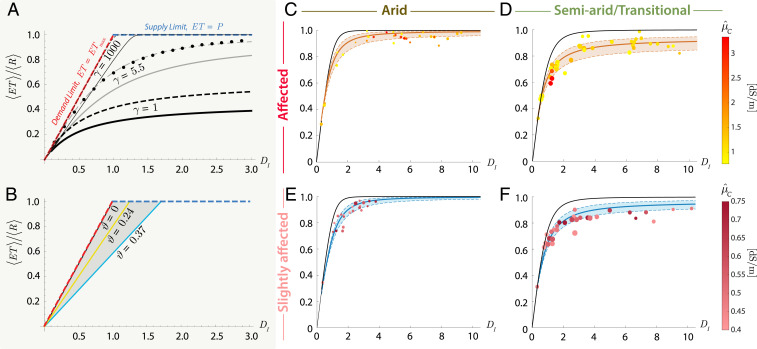
Fig. 2.
Salinity-dependent hydrological partitioning. (A) Average soil water balance as a function of the level of salinization of the basin and vegetation salt tolerance (S-D SWB; continuous lines) from Eq. 1, as contrasted to the balance in absence of salinity controls (P04; ref. 36; dashed lines), for wet (; bold black line), temperate (; thin gray line), and hyper-arid ( = 1,000; thin black line) hydro-climatic conditions. Black dots represent the classic semiempirical Budyko’s curve , which matches the P04’s curve for , , and cm (36). The S-D SWB is obtained for an of about 5 dS/m (equivalent to a saturated soil past concentration, , of 3.84 g/L for g/, mm, and ). This level of soil salinization also corresponds to the onset of salt stress for the moderately salt-tolerant species considered dominant over the basin ( L/g, g/L). (B) Demand limit for different values of virtual wilting point , corresponding to increasing salinity values and different plant salt-tolerance levels (i.e., , and moderately salt-tolerant dominant species, and and salt-sensitive dominant species, respectively; soil parameters as above). (C–F) Observed versus theoretical terrestrial water balance of affected (C and D) and slightly affected (E and F) river basins across arid (C and E) and semiarid (D and F) conditions. Bold black continuous lines represent the Budyko’s curves in the absence of salinity effects (P04; ref. 36) corresponding to the average hydro-climatic conditions of the four subgroups (arid-affected, semiarid-affected, arid-slightly affected, and semiarid-slightly affected). Solid orange (for affected) and blue (for slightly affected) lines represent the best estimate of the salinity-dependent Budyko’s curve obtained by fitting Eq. 1 to an ensemble of 1,000 subsamples randomly drawn from each basin subgroup (Materials and Methods). Dashed lines account for hydro-climatic variability across each basin subgroup and correspond to the 10th and 90th percentiles of , respectively. Dot size is proportional to .

