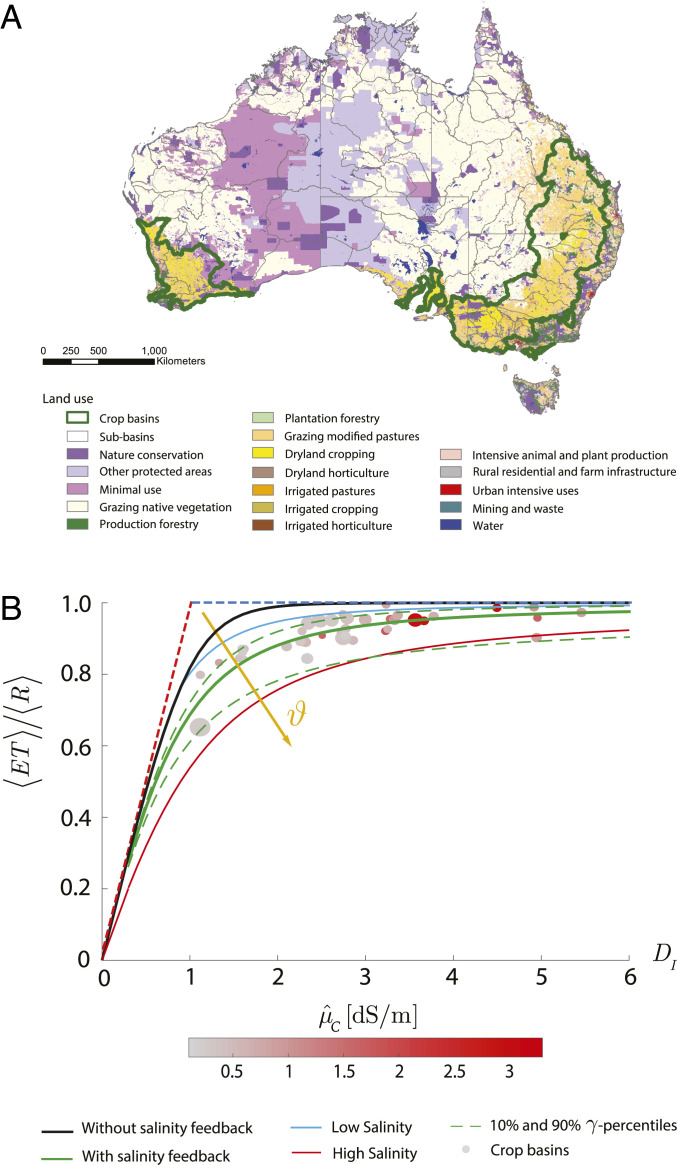
Fig. 3.
Inferring basin-scale salinization from observed hydrological partitioning. (A) Australian sub-basins subject to intensive agriculture and grazing (bold green contour) and land-use map from the Australian Bureau of Agricultural and Resource Economics and Sciences (ABARES; refs. 51 and 52). (B) Observed long-term water balance of crop-dominated Australian sub-basins (dots) versus the corresponding salinity-dependent soil water balance (Eq. 1; continuous green curve) and the classic hydrological partitioning in absence of salinity feedback (solid black line). Dashed lines and dot size are as in Fig. 2 C–F. The effect of different levels of salinization is highlighted by letting salinity vary between low ( = 400 g/; blue line) and high ( = 800 g/; red line) and keeping constant all of the other variables. The estimated parameters ( = 0.37 L/g, = 5.9 g/L, and = 650 g/) well reproduce the average level of salinization and plant salt tolerance of the moderately tolerant crops (e.g., canola, guar, rye, sorghum, and wheat; ref. 52) characterizing the study region (52, 53).

