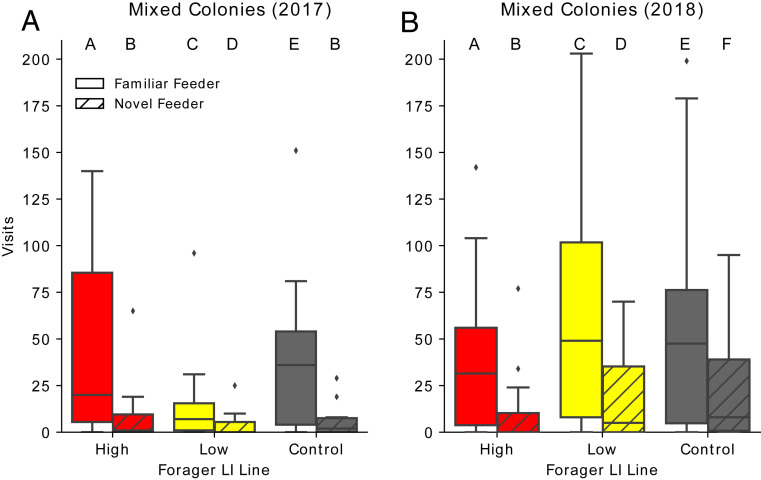
Fig. 3.
Visits of individuals from different genetically selected lines when in a mixed colony. Daily visits to the familiar (solid) and novel (hatched) feeders by individual bees in mixed colonies from low-LI parents (yellow), high-LI parents (red) or open-mated queens (gray) in (A) in 2017, n = 6 mixed colonies, 2,347 overall visits and in (B) in mixed colonies from lines that were reselected in 2018, n = 6 colonies, 6,272 overall visits. The horizontal line in the box is the median, the box is 25 to 75% of the data, whiskers represent 95% of the data, and diamonds show outliers beyond 95%. Different letters above boxes indicate statistically significant differences according to a post hoc Tukey test.

