Fig. 4.
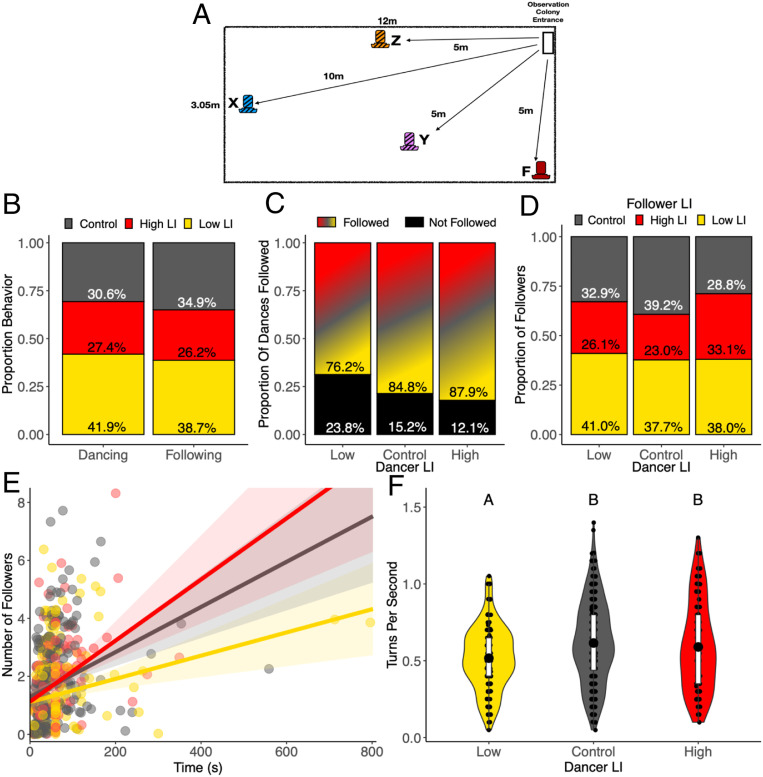
Recruitment dances facilitate integration of information from different genetically selected lines. (A) The experimental setup illustrating the location of feeders in relation to the location of the colony entrance (Top Right, white) within the experimental arena (large rectangle). The familiar feeder F (red) was provided on day 1 and on all subsequent days. Novel feeder X (blue) was presented on day 2, novel feeder Y (purple) on day 3, and novel feeder Z (orange) on day 4. See SI Appendix, Table S2, for associated odors. Visitations to novel feeders were combined for statistical analysis. (B) Proportion of dances (n = 667) or follows (n = 1,201) across six colonies performed by bees from each line, relative to their abundance in the mixed colony (350 high LI, 350 low LI, 700 control). We accounted for the difference in abundance of each selected line by dividing the number of observed control dancers by 2 before calculating these proportions. (C) Proportion of dances performed per LI line type that were either followed by at least one individual (colored) or not followed by any other bees (black). (D) Proportion of dances by LI line type that were followed (from B) broken down by LI of the follower. (E) Relationship between number of followers and duration of a dance by line. Point and line colors indicate LI of dancer. Best-fit line represents the GLM, and shaded area represents the 95% confidence interval. (F) Rate of turns per second in a dance by line. The large black dots in the violin shape is the mean, the white box in the violin shape is 25 to 75% of the data, and whiskers represent 95% of the data. The violin shapes illustrate distribution of the data. Different letters above violins indicate statistically significant differences according to a post hoc Tukey test.

