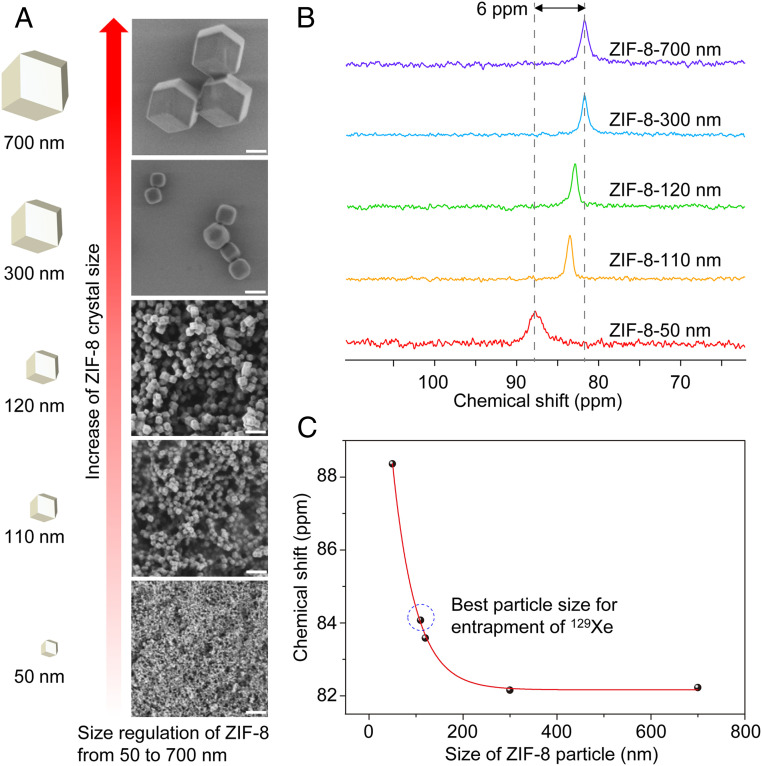
Fig. 2.
SEM images and 129Xe NMR spectra for different particle sizes of ZIF-8. (A) SEM images of ZIF-8 particles from 50 nm to 700 nm. (Scale bars, 200 nm.) (B) Hyperpolarized 129Xe NMR spectra for different sizes of ZIF-8 (2.5 mg/mL) in aqueous solution. For these spectra, a zg sequence was applied for acquisition (rectangular pulse, the pulse length p1 = 31.8 μs). NS = 32, LB = 15 Hz. (C) The chemical shift of entrapped 129Xe versus the particle size of ZIF-8 nanocrystals.

