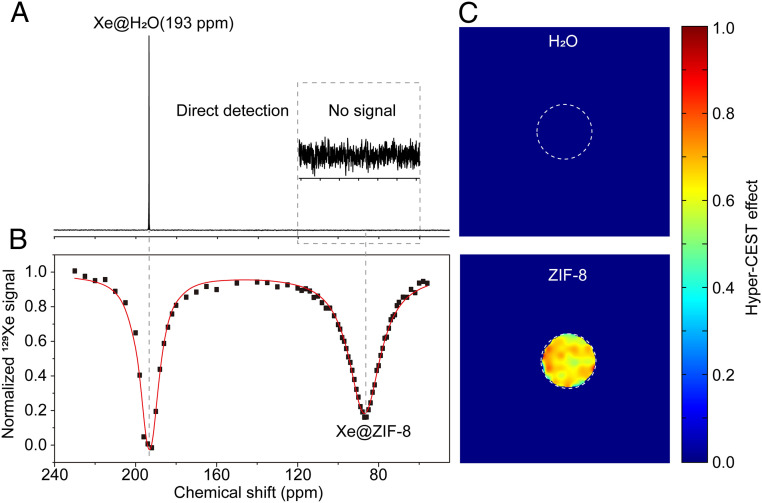
Fig. 3.
Hyper-CEST NMR and MRI of ZIF-8 at low concentration in aqueous solution. (A) 129Xe NMR spectra of ZIF-8 at low concentration (100 µg/mL) via direct detection method, NS = 1, LB = 5 Hz. (B) Hyper-CEST spectrum of low-concentration ZIF-8 (100 µg/mL) in H2O (a 6.5-μT, 10-s saturation pulse was used). (C) Hyper-CEST MRI of low-concentration ZIF-8 (100 µg/mL) in H2O. For the Hyper-CEST image, a 13-μT, 5-s saturation pulse was used. The image was acquired using a RARE sequence with 16 averages for each on- and off-resonant image.

