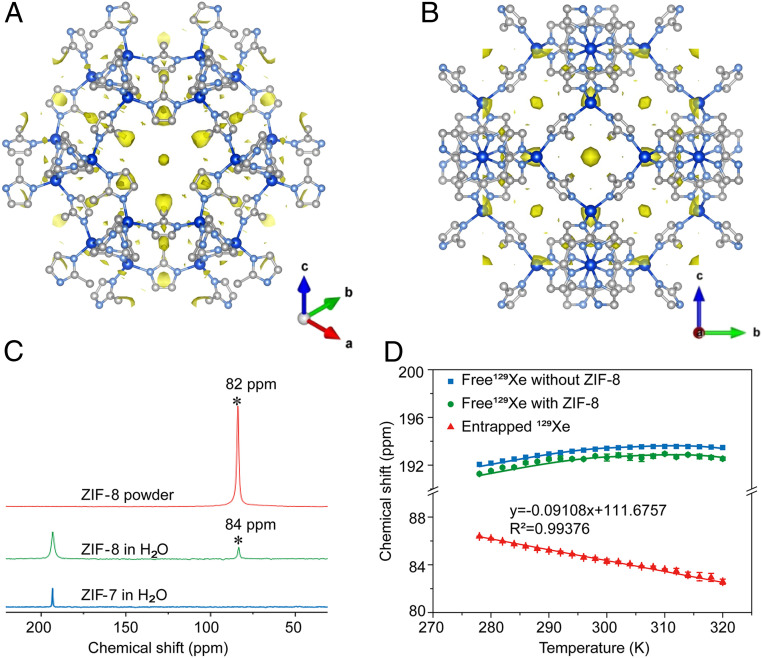
Fig. 4.
X-ray diffraction of ZIF-8 filled with Xe and 129Xe NMR spectra of ZIF-8 and ZIF-7. (A and B) Electron density maps of 129Xe in ZIF-8 pore visualized along [111] axis (A) and along [100] axis (B). Carbon, nitrogen, and zinc atoms are in white, light blue, and dark blue, respectively. (C) NMR spectra of hyperpolarized 129Xe interacting with ZIF-7 and ZIF-8 in aqueous solution (2.5 mg/mL) (NS = 32, LB = 40 Hz) and ZIF-8 powder (NS = 1, LB = 40 Hz). (D) Temperature dependence of hyperpolarized 129Xe chemical shift in ZIF-8 and H2O with each plot repeated in three parallel measurements. Error bars are ±SEM.

