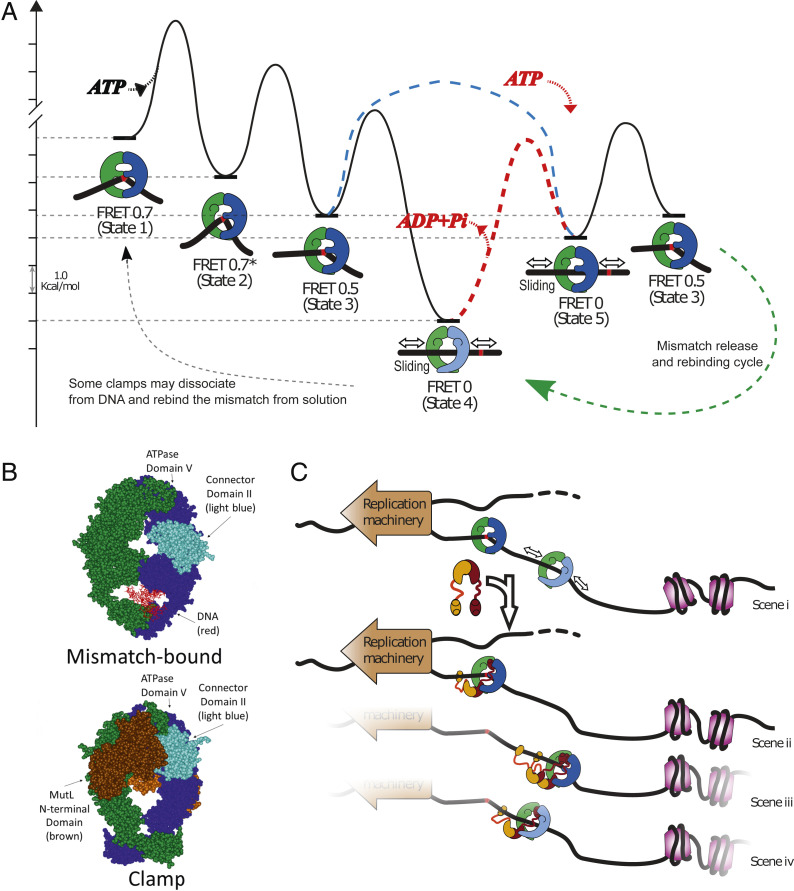
Fig. 4.
Modeling MutS and MutL actions in DNA MMR. (A) Free-energy landscape based on the rates of known steps (left to right) taken by MutS during transition from mismatch recognition (state 1) to mobile clamp (state 4) (SI Appendix, Supporting Methods). There are three known conformational states of the mismatch-bound MutS–DNA complex on the pathway to the mobile clamp (state 4): State 1: mismatch recognition and accompanying DNA bending (FRET 0.7); state 2: conformational change associated with increased DNA bending but no change in protein-DNA FRET (FRET 0.7*); state 3: additional conformational change associated with decreased DNA bending and lower protein-DNA FRET (FRET 0.5) (30). The initial mobile clamp (state 4) can undergo ATP-dependent conformational change to a new mobile clamp state (state 5), which can rebind the mismatch into intermediate state 3. The dashed red line indicates the event requiring ATP hydrolysis/nucleotide exchange (the red ATP binding and ADP+Pi leaving) to enable mismatch rebinding by the MutS clamp (the height of this transition is only illustrative, as it is unknown). The precise timing of ATP hydrolysis and ATP binding as MutS progress from state 4 through state 5 to state 3 remains undetermined. In addition, ATP hydrolysis could occur during the transition from the initial mismatch recognition state (state 1) to the mobile clamp state. Our experiments cannot determine the order in which states 4 and 5 occur upon initial mobile clamp formation with the light blue dashed line connecting state 3 directly to state 5 depicting an additional possibility for the first transition from initial mismatch recognition to mobile clamp. We only determine that once the mobile clamp is formed, ATP hydrolysis appears to be necessary to allow formation of state 5 (red pathway and red ATP binding/ADP+Pi release), which is capable of rebinding the mismatch. The light shading on MutS prior to this transition depicts a mobile clamp state (state 4) that is not capable of rebinding the mismatch. The dashed green line with arrow on the lower right represents the cycle of repetitive mismatch release and rebinding, including state 3, state 4, and state 5. The dashed gray line on the lower left represents stochastic events that could impact the ATPase turnover rate from bulk measurements (e.g., dissociation of a subpopulation of mobile clamps from DNA and rebinding to the mismatch from solution, instead of rebinding the mismatch on DNA). (B) Crystal structures compare E. coli MutS in the mismatch recognition state (1E3M.pdb) (Upper) (65) and the MutS–MutL sliding clamp state (5AKC.pdb) (Lower) (49). The connector domain II (residues 126 to 286) (light blue), ATPase domains (residues 568 to 800), the MutL N-terminal domain (brown), and the DNA (red) are indicated. The second MutL N-terminal domain on the back of the clamp is a lighter shade of brown. (C) MutS alone becomes a mobile clamp following mismatch detection (scene i). Its movement on DNA is bounded by the replication machinery and packaging of newly synthesized DNA (nucleosome assembly, purple), and may help keep DNA flanking the mismatch transiently clear for repair. The limited range of motion also increases the probability of repeated encounters between MutS and the mismatch and facilitates localization of MutS–MutL complexes nearby. (scenes ii to iv) One or more MutL proteins (burgundy and ochre) can stop MutS at the mismatch (scene ii, MutS in state 3) or away from the mismatch in mismatch rebinding (scene iii, MutS dark shading, state 5) or nonbinding (scene iv, MutS light shading, state 4) states.

