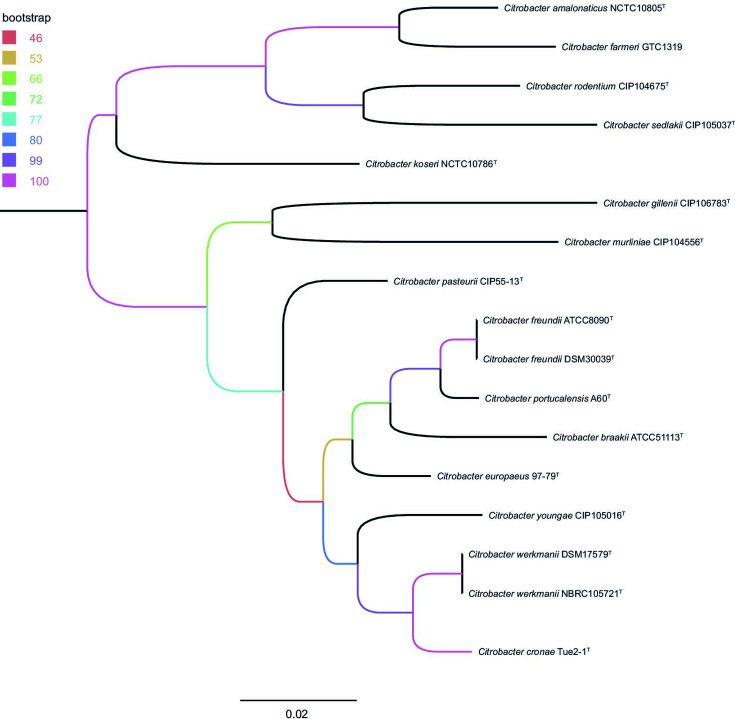
Fig. 1.
Multilocus sequence analysis of concatenated partial fusA, leuS, pyrG and rpoB gene sequences extracted from whole genome data of the study isolates (Citrobacter cronae Tue2-1T, Tue2-3, Tue2-5 – Tue2-11) and available genome data of Citrobacter type strains. The scale bar represents the expected number of changes per site. Bootstrap values [%] are colour-coded for all nodes (based on 1000 replicates). The tree was rooted at midpoint.

