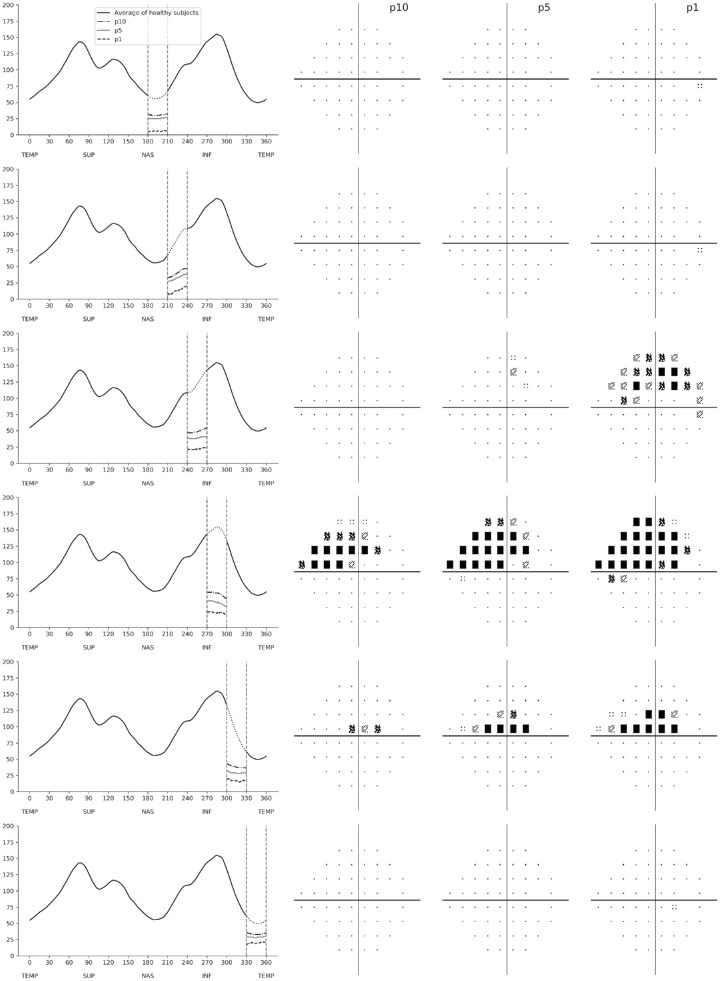
Figure 6.
Patterns of visual field loss predicted from the convolutional neural network when simulating RNFL defects in the inferior hemiretina. The RNFL profile is shown on the left, with dashed vertical lines showing the location of the simulated RNFL defect. For each simulated defect in a particular location, there were three simulated depths representing the 10th (p10), 5th (p5), and 1st (p1) percentiles. The corresponding predicted standard automated perimetry pattern deviation plots are shown on the right.

