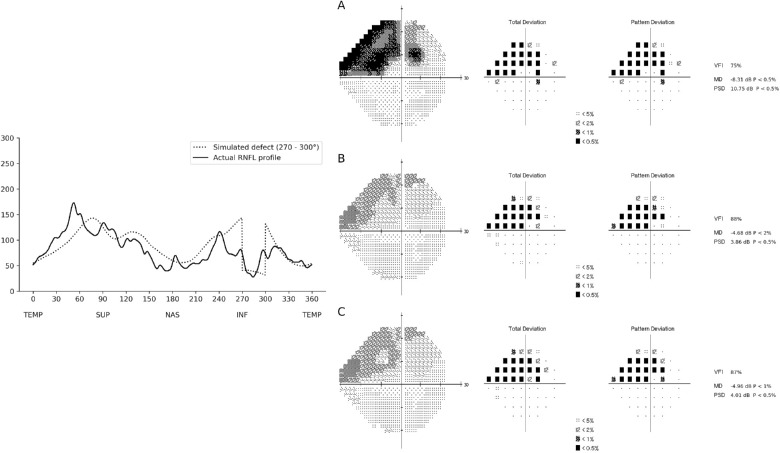
Figure 8.
Example of a RNFL profile included in the test sample that closely resembled a RNFL profile with a localized defect in the temporal inferior region of the RNFL (270°–300°). The actual RNFL thickness is represented on the left (solid line), while the dotted line represents the simulated RNFL thickness. The corresponding visual fields are represented on the right, where (A) represents the actual visual field of the individual, (B) represents the visual field predicted by the CNN using the actual RNFL thickness of the individual, and (C) represents the visual field predicted by the CNN using the simulated RNFL thickness profile. In this example, the localized defect in the temporal inferior RNFL was associated with a superior arcuate defect on the visual field. The visual fields predicted by the CNN presented a defect with similar location and depth.

