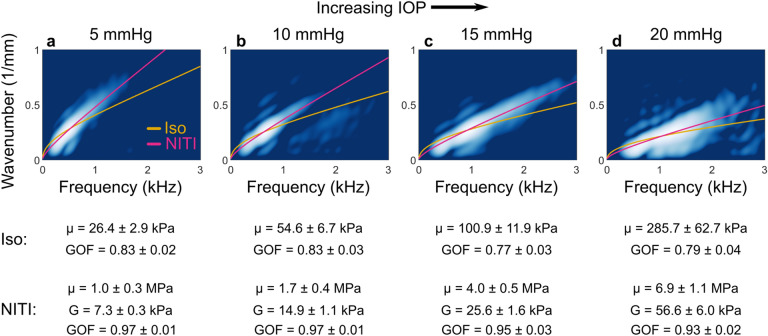
Figure 5.
2D Fourier spectra of wave fields generated and tracked with AμT-OCE along the surface of ex vivo porcine cornea at varying intraocular pressure (IOP). At each IOP, the NITI model (pink line) more closely matches the mode behavior compared to the isotropic model (yellow line). Spectra are shown on a log scale over a 20-dB dynamic range at 5 mmHg IOP (a), 10 mmHg IOP (b), 15 mmHg IOP (c), and 20 mmHg IOP (d). Parameter estimates and goodness-of-fit (GOF) metrics (mean ± standard deviation, calculated over repeated OCE measurements for a given cornea/IOP) for each model are shown below their corresponding IOP.

