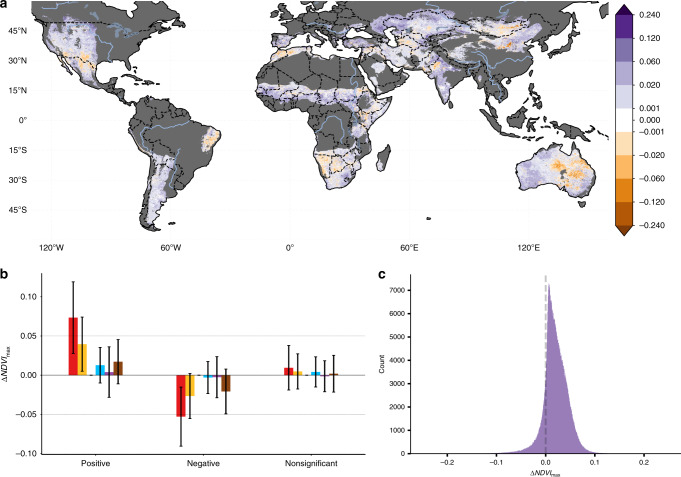
Fig. 2. The contribution of anthropogenic climate change to vegetation change from 1982 to 2015.
a The contribution of anthropogenic climate change (Climate Change + O2) component to the change in vegetation between 1982 and 2015 (ΔNDVImax). Non-dryland and hyper-arid regions are masked in dark gray and areas where the change is insignificant (αFDR = 0.10) or smaller than the error in the sensors (±0.001) are masked in white. b The mean area-weighted pixel effect size of the drivers of observed vegetation broken down by observed vegetation change direction. Positive indicates greening and negative is desertification. Error bars show the SD. c Frequency distribution function for the change in NDVImax (1982–2015) attributed to by anthropogenic climate change.

