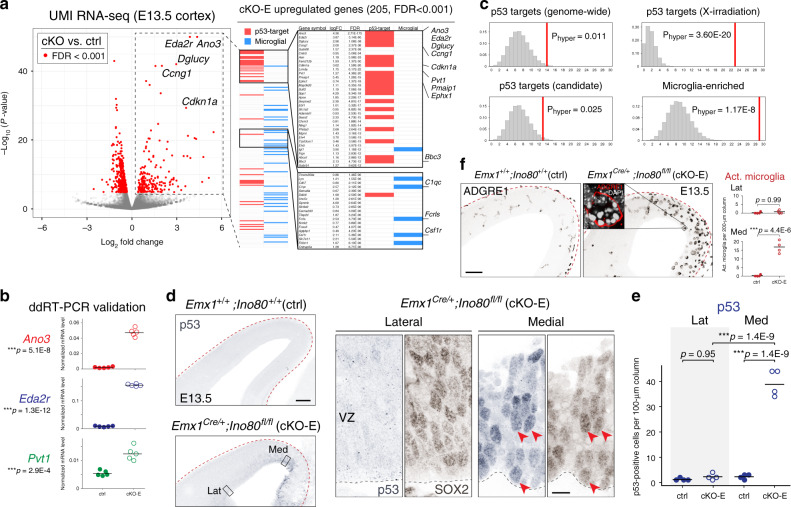
Fig. 3. p53 and microglial activation in medial cortex following Ino80 deletion.
a Volcano plot of unique molecular identifier (UMI) RNA-seq comparing E13.5 cortex of cKO-E (n = 5 animals) with ctrl (n = 7 animals). For each gene, P value was calculated with likelihood ratio tests and false discovery rate (FDR) was calculated using the Benjamini–Hochberg procedure. Differentially expressed genes (FDR < 0.001) are indicated by red dots. Of the 205 significantly upregulated genes in cKO-E, 36 are known p53 targets (red bars) and 31 are expressed selectively in microglia (blue bars). b ddRT-PCR validated significant upregulation of p53-target genes Ano3, Eda2r, and Pvt1 in cKO-E compared with ctrl E13.5 cortex (data are mean, two-tailed unpaired t test, n = 5 animals). c Intersectional analysis of the 205 upregulated genes in cKO-E revealed significant enrichment of p53 targets and microglia genes. The distribution of random overlap is shown in histogram, and the observed overlap is indicated by vertical red line (hypergeometric test, Bonferroni correction, α = 0.0125). The subset of p53-target genes upregulated by X-irradiation-induced DSBs were especially overrepresented in cKO-E-upregulated genes. d, e p53 immunostaining (blue) revealed significant increase in the number of p53-positive cells in medial, but not lateral, cKO-E E13.5 neocortex compared with ctrl (data are mean, one-way ANOVA with Tukey’s post hoc test, n = 4 animals). p53 activation was present in SOX2 + (brown) NPCs (solid arrowheads) in cKO-E. f ADGRE1 (F4/80) immunostaining revealed an increase in morphologically activated (Act.) microglia in medial, but not lateral, cKO-E neocortex at E13.5 (data are mean, two-tailed unpaired t test, n = 4 animals). ADGRE1 + microglia (red, inset) phagocytosed numerous pyknotic nuclei labeled by DAPI (white). Scale bar: 100 μm in d, f; 10 μm in d inset.

