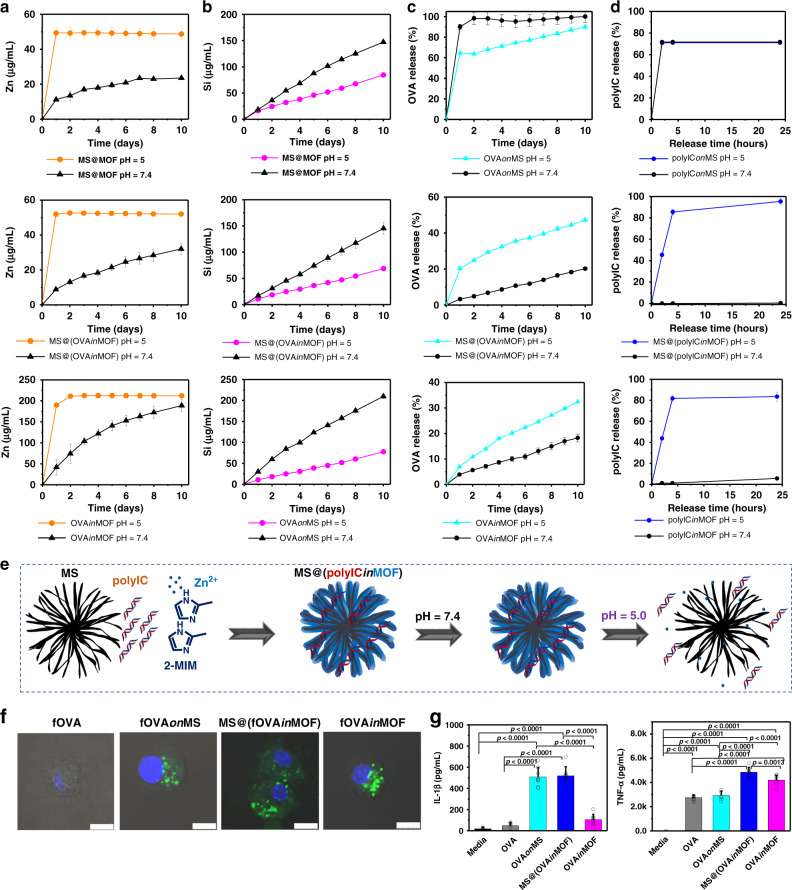
Fig. 2. Degradation and biomolecule release of nanoadjuvants, and BMDCs activation in vitro.
a, b pH-responsive degradation of MS, MOF-gated MS and MOF (n = 3 independent samples); c OVA release from OVAonMS, MS@(OVAinMOF) and OVAinMOF at different pH values (n = 4 independent samples); d polyIC release from polyIConMS, MS@(polyICinMOF) and polyICinMOF at different pH values (n = 3 independent samples). e Scheme of MS@(polyICinMOF) fabrication and its release under different pH values. f Confocal laser scanning microscopic images of the cellular uptake of free fOVA, fOVAonMS, MS@(fOVAinMOF) and fOVAinMOF by BMDCs. Hoechst, blue; fOVA (model cancer antigen), green. Scale bars, 10 μm. g IL-1β and TNF-α secreted by BMDCs when culturing with different nanoadjuvants at day 1 (n = 8 independent samples, one-way ANOVA followed by Tukey’s multiple comparisons post hoc test; IL-1β, p < 0.0001; TNF-α, p < 0.0001). All data in a–d are presented as mean ± S.D. Data in g are presented as mean + S.D.

