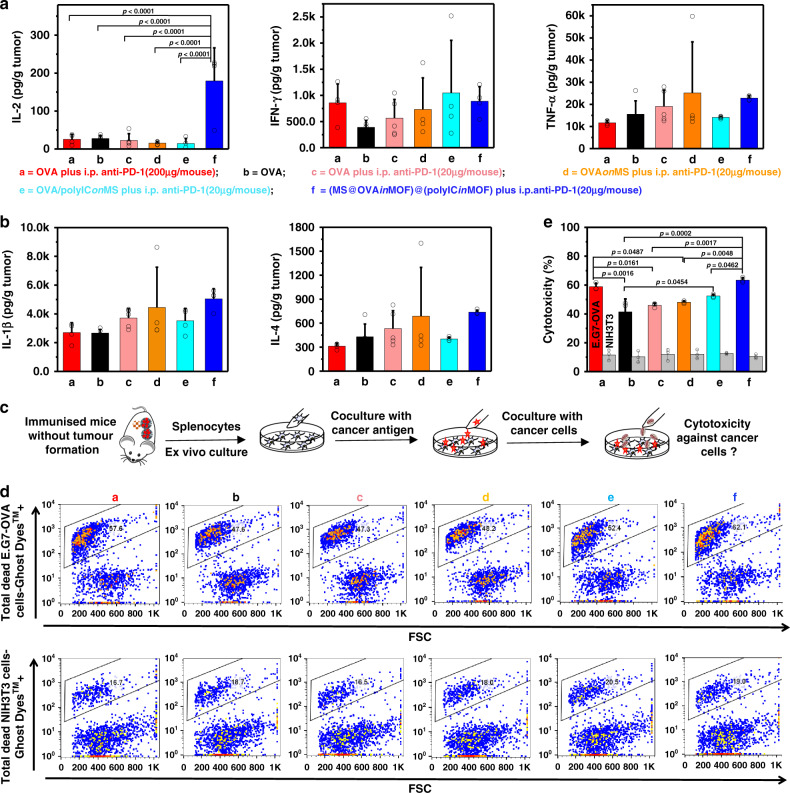
Fig. 6. Cytokines secretion in tumour sites and OVA-specific cytotoxic CD8+ T-cell killing.
a, b Cytokines in tumour at the endpoint (a, d, e, f, n = 4 independent animals; b, c, n = 5 independent animals; one-way ANOVA followed by Tukey’s multiple comparisons post hoc test; IL-2, p < 0.0001). c A schematic representation of antigen-specific cytotoxic T lymphocyte assay. The splenocytes were obtained from mice at the endpoint and cocultured with CFSE - stained live E.G7-OVA cancer cells or healthy NIH3T3 cells at the ratio of E/T = 10 and the specificity of cytotoxic CD8+ T cells against OVA were analysed using Ghost Dye™ Violet 450 staining and flow cytometry. d Representative flow cytometry plots of the splenocytes derived from different mice against E.G7-OVA cancer cells or healthy NIH3T3 cells. e Cytotoxicity of the splenocytes derived from different mice against E.G7-OVA cancer cells or healthy NIH3T3 cells (n = 3 independent samples, one-way ANOVA followed by Tukey’s multiple comparisons post hoc test; E.G7-OVA, p = 0.0002). All data (a, b, e) are presented as mean + S.D.

