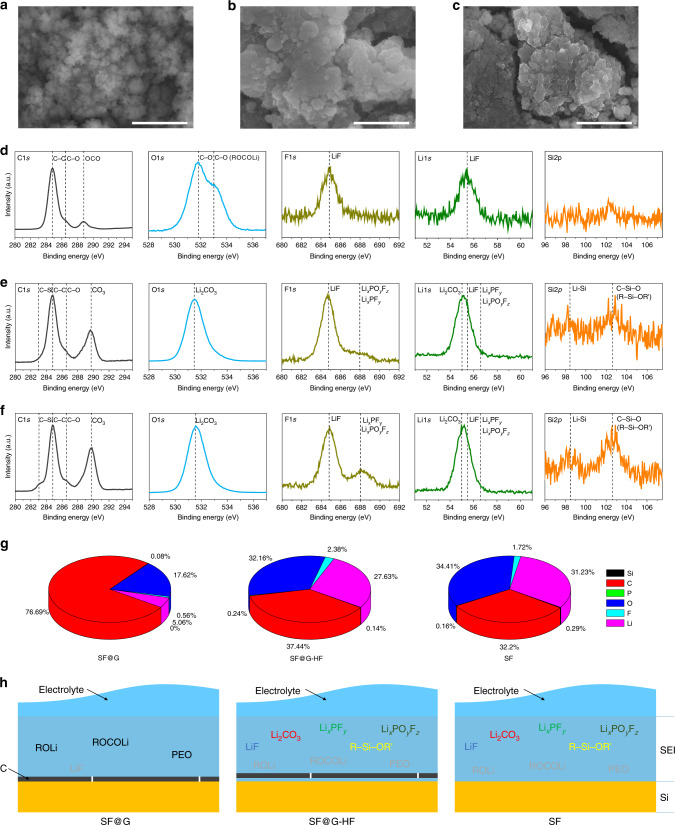
Fig. 5. Interfacial morphology and chemical composition after cycling.
a–c SEM images of (a) SF@G, (b) SF@G-HF, and (c) SF after 100 cycles. d–f C 1s, O 1s, F 1s, Li 1s, and Si 2p XPS spectra of (d) cycled SF@G, (e) cycled SF@G-HF, and (f) cycled SF. g Interfacial atom concentrations of cycled SF@G, SF@G-HF, and SF. h Schematic description of the interface of cycled SF@G, SF@G-HF, and SF, showing distinctly different components as the majority of cycled SF@G and control samples. It is noteworthy that the components annotated in gray represent the minority and the SEI thickness is not scaled. Scale bars, 2 µm (a–c).

