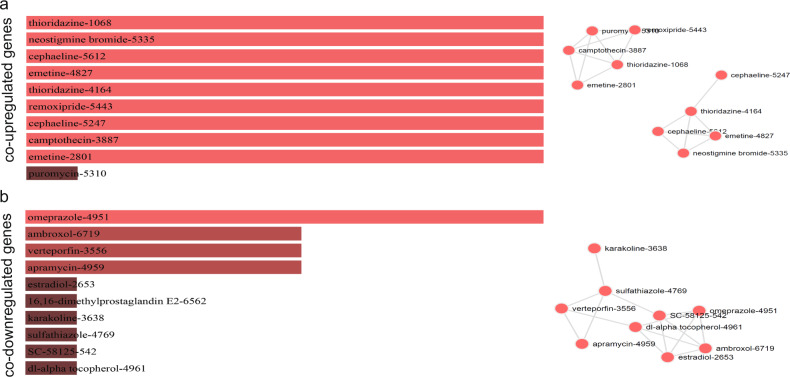
Fig. 6. Repurposing drugs targeting the co-upregulated or co-downregulated genes in colorectal cancer, and the networks that they form.
Τhe bar graphs are sorted by the combined score. The length of each bar represents the significance of its corresponding term. The brighter the color, the more significant that term is. The drugs in the network are sized according to their degree (number of edges), whereas the thickness of a connecting edge is proportional to the partial correlation coefficient between the two drugs. The nodes are arranged so that the edges are of more or less equal length and there are as few edge crossings as possible. For clarity, only the top 10 drugs ranked by partial correlation coefficient are shown.

