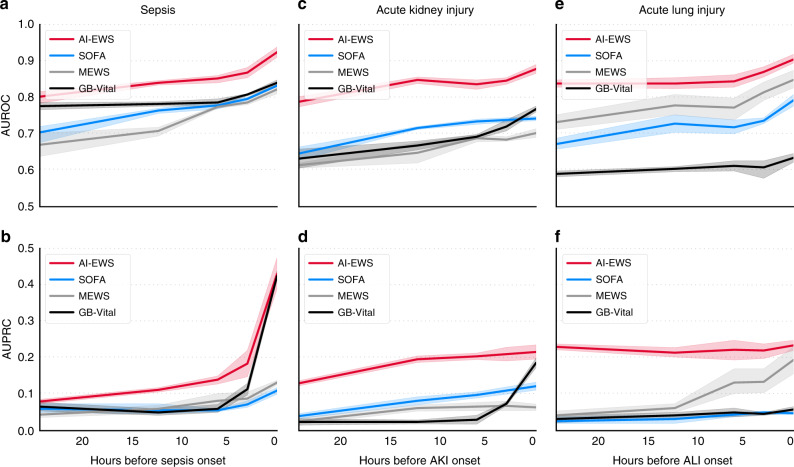
Fig. 2. Predictive performance of the xAI-EWS.
The xAI-EWS results are compared with those from MEWS, SOFA, and the gradient boosting vital sign model (GB-Vital). Predictive performance is shown from the onset time to 24 h before onset. AUROC performance is shown for sepsis (a), AKI (c), and ALI (e), and AUPRC performance is shown for sepsis (b), AKI (d), and ALI (f). The solid lines indicate mean values. Lighter semitransparent colors surrounding the solid lines indicate uncertainty by 95% confidence intervals calculated from the five test datasets (n = 163,050 patients examined over 5 cross-validation folds with a test size of 10%).

