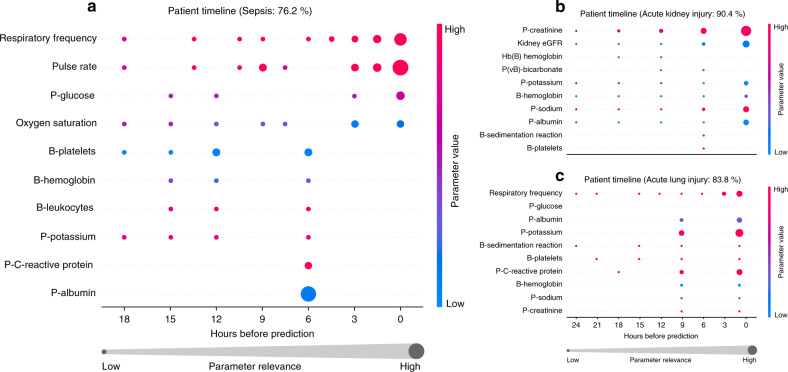
Fig. 3. Results from the explanation module displays for three individual patients.
Three selected patient timelines with back-propagated relevance for sepsis (a), AKI (b), and ALI (c) are shown. Only the 10 highest-ranking parameters in descending order by the mean relevance are displayed. The data shown in the three timelines match the data from the observation window, such that a time equal to zero is the prediction time. The data-points are colored according to the 5th and 95th percentiles for each parameter across the whole dataset. The blue data-points correspond to a value between 0 and the 5th percentile, the red data-points correspond to a value between the 95th and 100th percentiles, and data-points with values close to the median are purple. P, plasma; eGFR, estimated Glomerular filtration rate.

