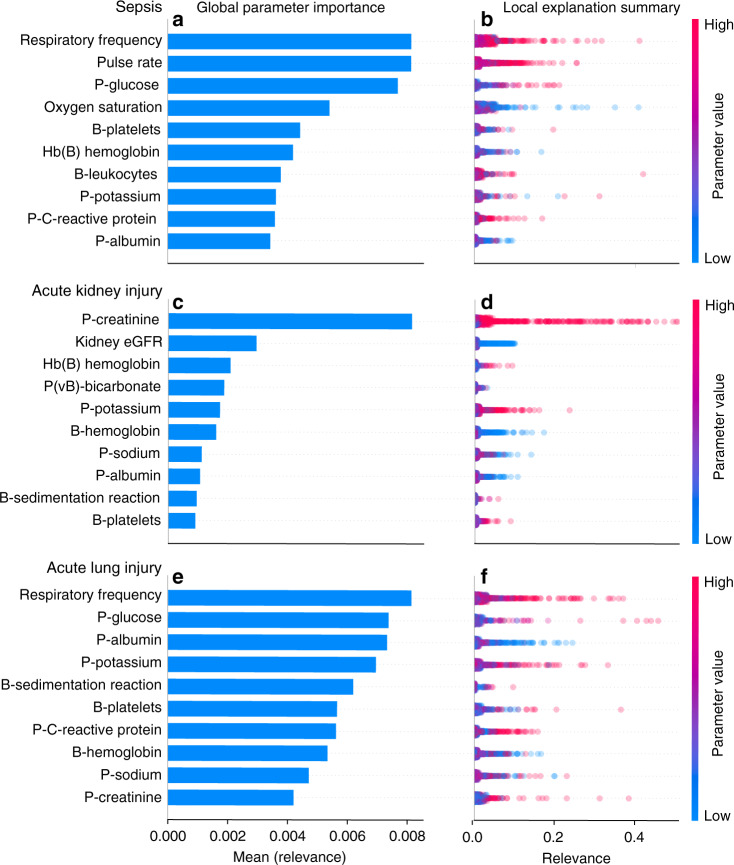
Fig. 4. Results from the explanation module displaying the global parameter importance and local explanation summary.
The parameters are sorted in descending order according to global parameter importance, defined by the mean relevance, which is identified by the blue horizontal bars for sepsis (a), AKI (c), and ALI (e). The local explanations summary shows all the individual data-points, colored by parameter value and displaced by the mean relevance for sepsis (b), AKI (d), and ALI (f). The height of the data-points shown for each parameter in the local explanation summary correlate with the number of data-points at the associated level of relevance. The population-based perspective is simplified by ignoring the temporal relevance variations, treating all data-points at different times equally. P, plasma; eGFR, estimated Glomerular filtration rate.

