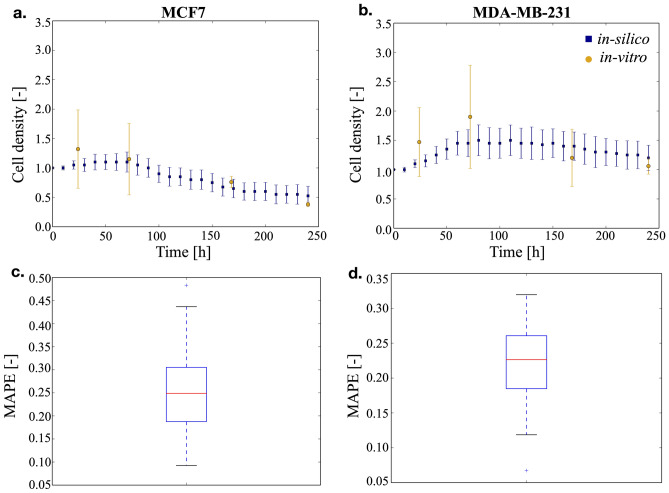
Figure 1.
Time course of the cell density within the scaffold and concordance between in-silico and in-vitro data. In (a) MCF7 cells are considered, while in (b) MDA-MB-231 cells are shown. Both the experimental (circles) and the simulated (squares) data are reported as average and standard deviation. For graphical clarity only one point every 10 h is reported for the in-silico results. Panels (c) and (d) report the distribution of the mean average percentage error (MAPE) for MCF7 and MDA-MB-231 cells respectively.

