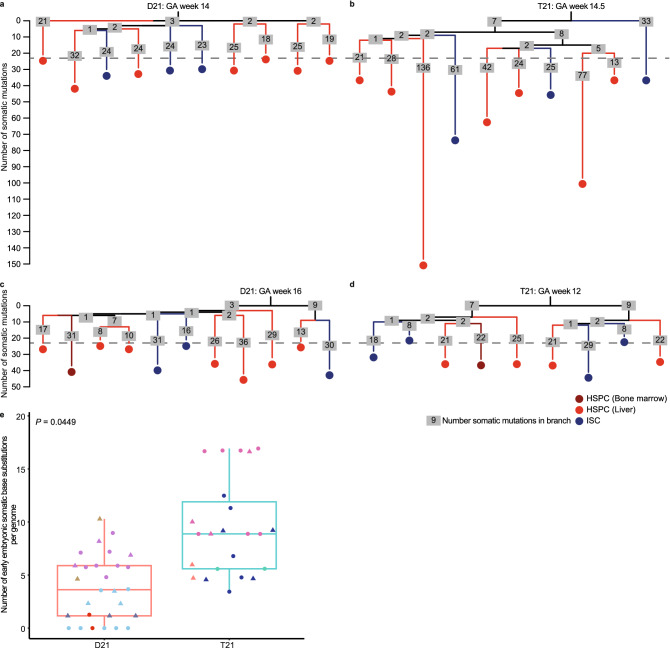
Figure 3.
Phylogenetic lineage trees of disomy 21 (D21) and trisomy 21 (T21) fetuses. (a) Lineage trees of a gestational age (GA) week 14 D21 fetus, b gestational age week 14,5 T21 fetus, c gestational age week 16 D21 fetus and d gestational age week 12 T21 fetus. Each tip represents a single clonally expanded cell. The length of the branches indicates the number of somatic mutations in that branch of the tree. The number of somatic mutations in each branch are shown in grey boxes. e Comparison of the number of somatic base substitutions per genome between D21 and T21 fetal stem and progenitor cells, that occurred early in the development of the fetus (D21 fetal: 28 clones; 5 donors, T21 fetal: 23 clones; 4 donors). Circle: Haematopoietic stem and progenitor cells, Triangle: intestinal stem cells. Points with the same color indicate single cells from the same subject. (linear mixed-effects model, two-tailed t-test).

