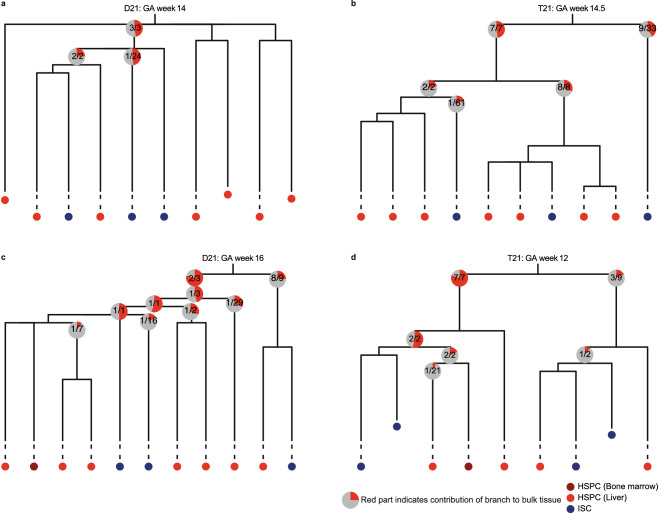
Figure 4.
Relative contribution of the developmental lineage branches to fetal skin tissue. (a) Lineage trees of a gestational age (GA) week 14 D21 fetus, (b) gestational age week 14,5 T21 fetus, (c) gestational age week 16 D21 fetus and (d) gestational age week 12 T21 fetus. Each tip represents a single clonally expanded cell. The pie charts show the median contribution of the contributing mutations in a branch to the bulk skin tissue. The grey part of the pie chart indicates the total skin tissue, while the red part shows the contribution of a single branch to the skin tissue. The text in the pie charts shows how many of the mutations in that branch contributed to the skin tissue. Mutations not contributing to the skin tissue at all, are not used to calculate the median. Multiple pie charts in a single branch indicate that the mutations in that branch occurred during different cell divisions.

