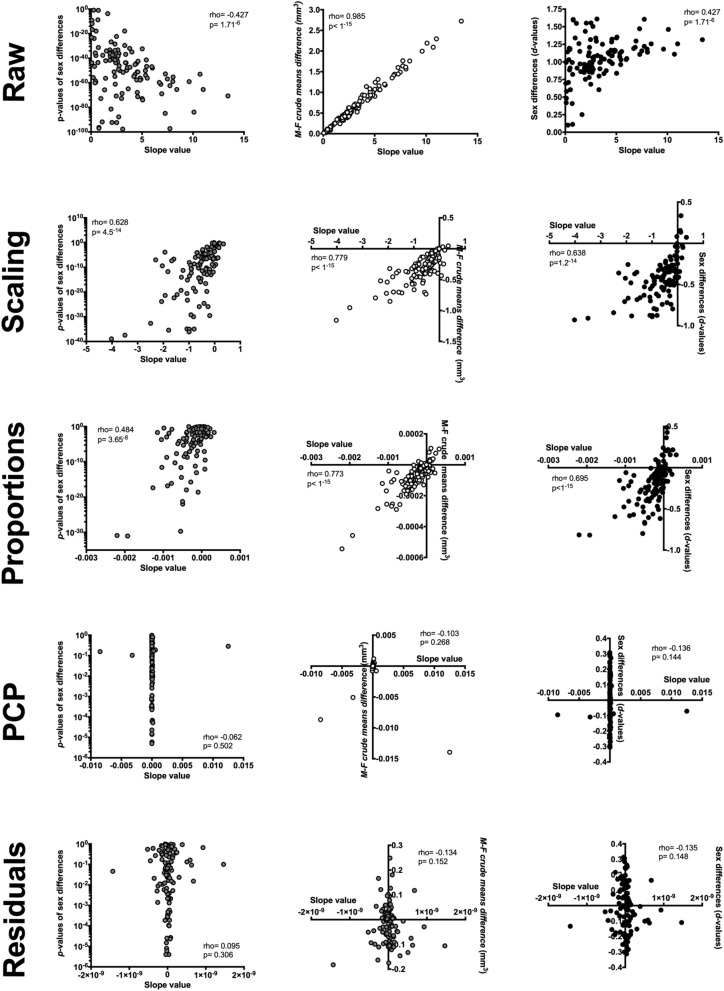
Figure 2.
Correlation between TIV-VOI slopes and observed sex differences in each data set. Ordinal correlations (Spearman’s rho) were calculated between the slope values of the TIV-VOI regression lines (provided in Supplementary Tables 1B–5B) and the p-values (left column), unstandardized means difference (central column), and Cohen’s d values (right column) of the sex differences obtained in the raw, scaling, proportions, PCP, and residuals datasets. Note that the scales and labels’ positioning are customized in each figure to better show the very distinct patterns of correlations observed in each dataset.

