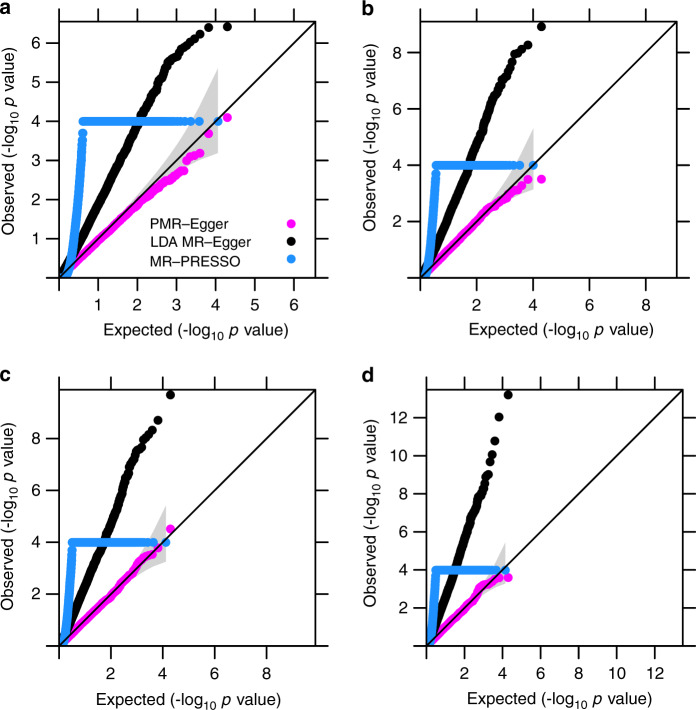
Fig. 3. Type I error control for different methods on testing pleiotropy.
Quantile–quantile plot of −log10 p-values from different methods for testing the horizontal pleiotropic effect either in the absence or in the presence of causal effect under null simulations. Compared methods include PMR-Egger (magenta), LDA MR-Egger (black), and MR-PRESSO (dodger blue). Null simulations are performed under different causal effect sizes characterized by PVEzy: a PVEzy = 0; b PVEzy = 0.2%; c PVEzy = 0.4%; and d PVEzy = 0.6%. Only p-values from PMR-Egger adhere to the expected diagonal line across a range of horizontal pleiotropic effect sizes. Due to heavy computational burden, we are only able to run 10,000 permutations for MR-PRESSO. Therefore, the minimal p-value from MR-PRESSO is 10−4.

