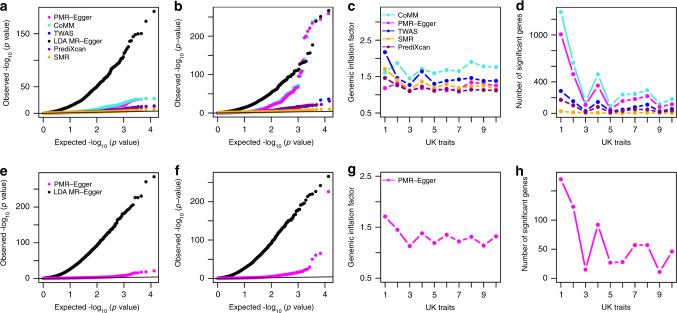
Fig. 6. TWAS analysis results by different methods for UK Biobank traits.
Compared methods include CoMM (turquoise), PMR-Egger (magenta), TWAS (blue), LDA MR-Egger (black), SMR (orange), and PrediXcan (purple). a Quantile–quantile plot of −log10 p-values from different methods for testing the causal effect for an exemplary trait BMI. b Quantile–quantile plot of −log10 p-values from different methods for testing the causal effect for another exemplary trait platelet count. c Genomic inflation factor for testing the causal effect for each of the 10 traits by different methods. d Number of causal genes identified for each of the 10 traits by different methods. e Quantile–quantile plot of −log10 p-values from different methods for testing the horizontal pleiotropic effect for an exemplary trait BMI. f Quantile–quantile plot of −log10 p-values from different methods for testing the horizontal pleiotropic effect for another exemplary trait platelet count. g Genomic inflation factor for testing the horizontal pleiotropic effect for each of the 10 traits by different methods. h Number of genes identified to have significant horizontal pleiotropic effect for each of the 10 traits by different methods. For c, d, g, h, the number on the x axis represents 10 traits in order: Height, platelet count, bone mineral density, red blood cell count, FEV1–FVC ratio, BMI, RDW, eosinophils count, forced vital capacity, white blood cell count.

