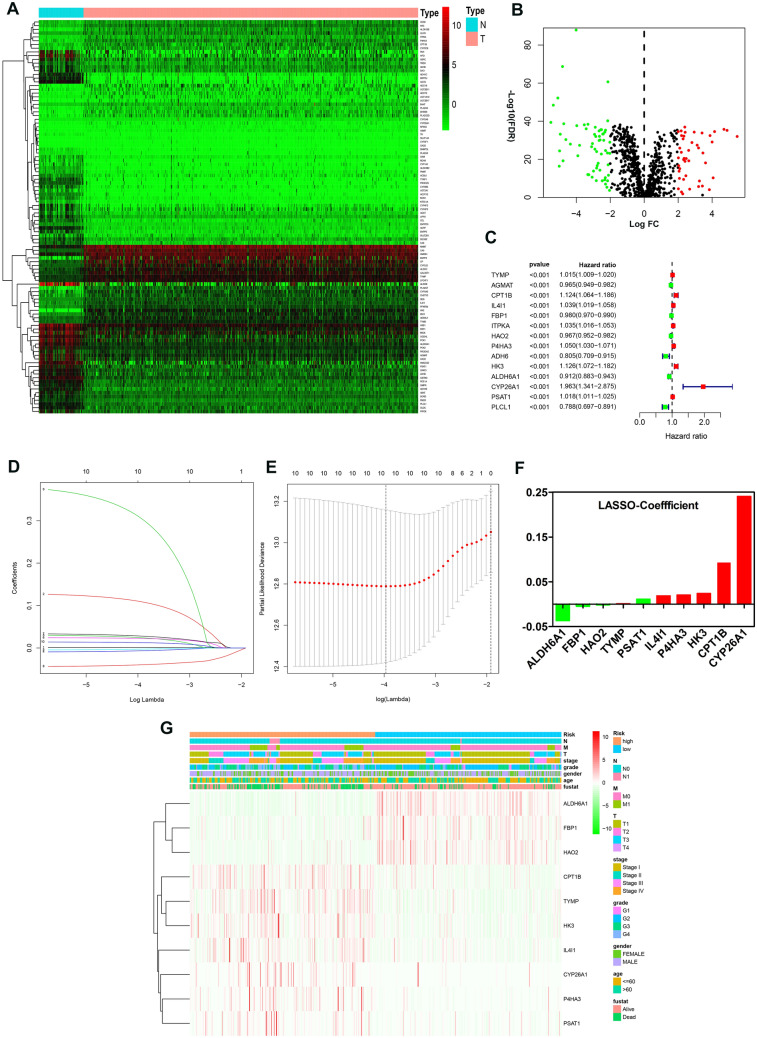
Figure 1.
Identification of a metabolism-related signature by Cox proportional hazards model in TCGA cohort. (A,B) Heatmap and Volcano plot of 105 differentially expressed metabolism-related genes. (C) Forrest plot of results of the univariate Cox regression analysis (P < 0.001). (D,E) Lasso Cox regression algorithm. (F) Coefficient value for each of the 10 active covariates genes (red represents upregulated in tumor, while green indicates the downregulated), X-axis represents gene name, and Y-axis represents the coefficient value of the model. (G) Heatmap of the 10 genes of the signature based on the risk score value.

