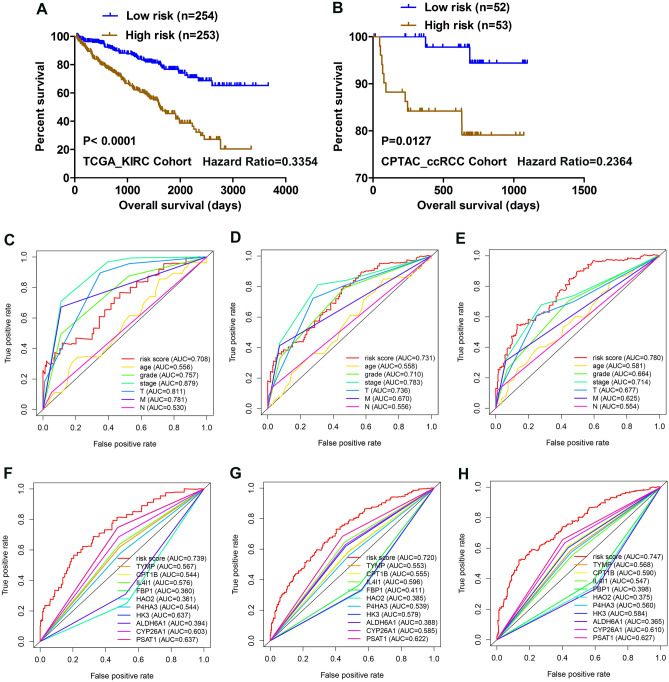
Figure 2.
Kaplan–Meier analysis and time-dependent ROC analysis for the 10-gene signature in ccRCC. (A) Kaplan–Meier curve with Log-rank test in TCGA_KIRC Cohort. (B) Kaplan–Meier curve with Log-rank test in CPTAC_ccRCC Cohort. (C–E) ROC curve of model and clinical characteristics predicting 1-, 3- and 5-year survival based on TCGA training set. (F–H) ROC curve of model and single gene predicting 1-, 3- and 5-year survival based on TCGA training set.

