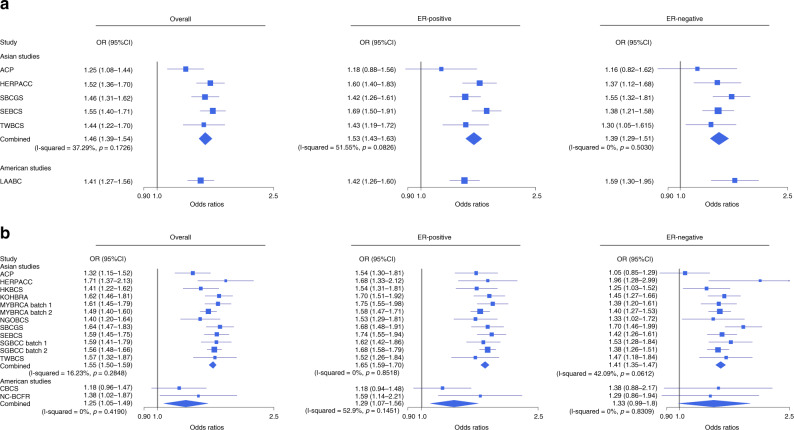
Fig. 1. Association between standardised 287-SNP polygenic risk scores and breast cancer risk.
Panel a shows the results for iCogs array by study and panel b shows the results for Oncoarray. The squares represent the odds ratios (ORs) and the horizontal lines represent the corresponding 95% confidence intervals. Overall estimates within genotyping array were obtained by combining the estimates across studies using fixed-effect meta-analysis, represented by the diamond shape. I-squared and p value (two-sided) for heterogeneity were obtained by fitting a random-effects model and using generalised Q-statistic estimator (the rma() command in R). The sample size of individual studies are listed in Supplementary Table 1. The ORs and corresponding 95% confidence intervals are provided as a Source Data file.

