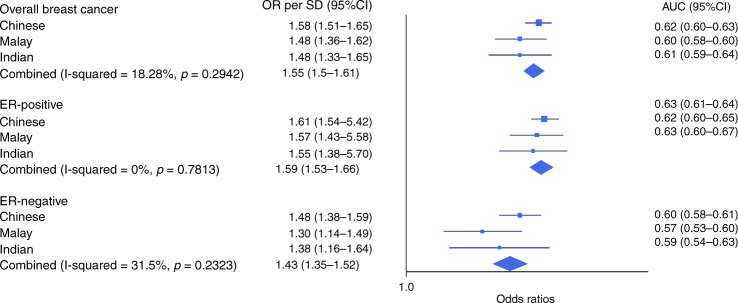
Fig. 3. Association between standardised PRSs and breast cancer risk in Chinese, Malay and Indian women from Malaysia and Singapore.
Odds ratios (ORs) and AUCs were generated using data from Malaysia Breast Cancer Genetics (MyBrCa) and Singapore Breast Cancer Cohort (SGBCC) studies, stratified by ethnicity. The squares represent the odds ratios (ORs), the horizontal lines represent the corresponding 95% confidence intervals and the diamond shapes represent the overall estimates. I-squared and p value (two-sided) for heterogeneity were obtained by fitting a random-effects model and using generalised Q-statistic estimator (the rma() command in R). The number of cases and controls for each ethnicity by breast cancer subtypes are tabulated in Table 4. The sample size, ORs and corresponding 95% confidence intervals are also provided in the Source Data file.

