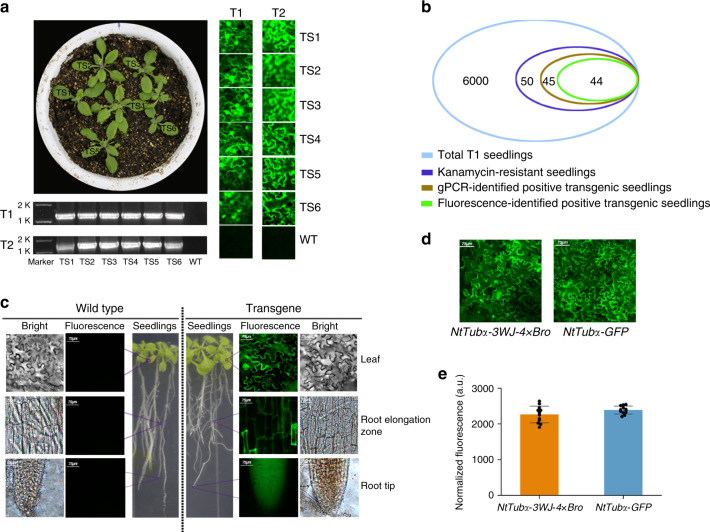
Fig. 7. Identification of transgenic A. thaliana and expression analysis of target genes using the 3WJ-4 × Bro/DFBH-1T reporter system.
a, b Identification of T1 and T2 transgenic A. thaliana. a Representative image of transgene identification by 3WJ-4 × Bro fluorescence (right) and RT-PCR (bottom). TS transgenic lines, WT wild type, T1, T2 transgenic generations 1 and 2. b Numerical comparison of positive transgenic plants identified by the two methods above. c Expression of NtTubα-3WJ-4 × Bro in different tissues of transgenic A. thaliana. The wild type was used as control. d The imaging comparison of the 3WJ-4 × Bro/DFBH-1T system (left) and the GFP reporter system (right). Scale bars, 75 μm. e Quantitative comparison of fluorescence intensity between the 3WJ-4 × Bro/DFBH-1T and GFP reporter systems. Error bars depict the mean ± s.d. (n = 12). All experiments were repeated three independent times with the same conclusion. Source Data underlying a–c, e are provided as a Source Data file.

