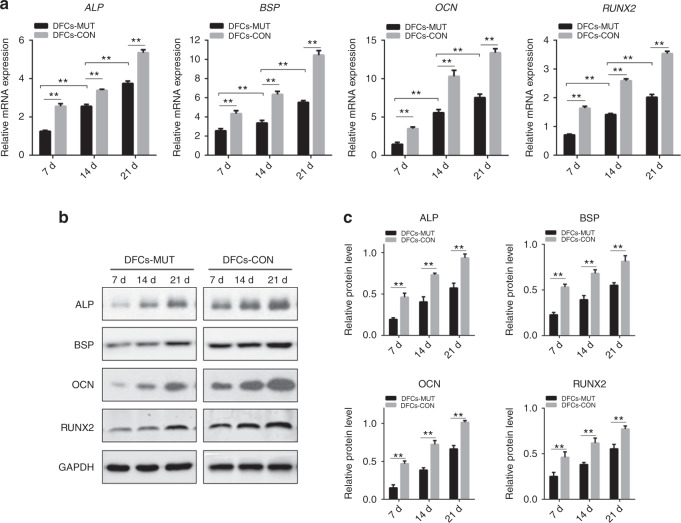
Fig. 4.
Analysis of the mRNA and protein expression of osteogenic differentiation markers during the osteogenic differentiation of DFCs. a Histograms showing the relative mRNA levels of ALP, BSP, OCN, and RUNX2 during the induction of differentiation. The mRNA levels were determined using RT-PCR with GAPDH as a reference for normalization. b Representative western blots showing the protein levels of ALP, BSP, OCN, and RUNX2. c Histograms showing the relative protein levels of ALP, BSP, OCN, and RUNX2 during the induction of differentiation. Values are means ± SD of three independent experiments (*P < 0.05 and **P < 0.01)

