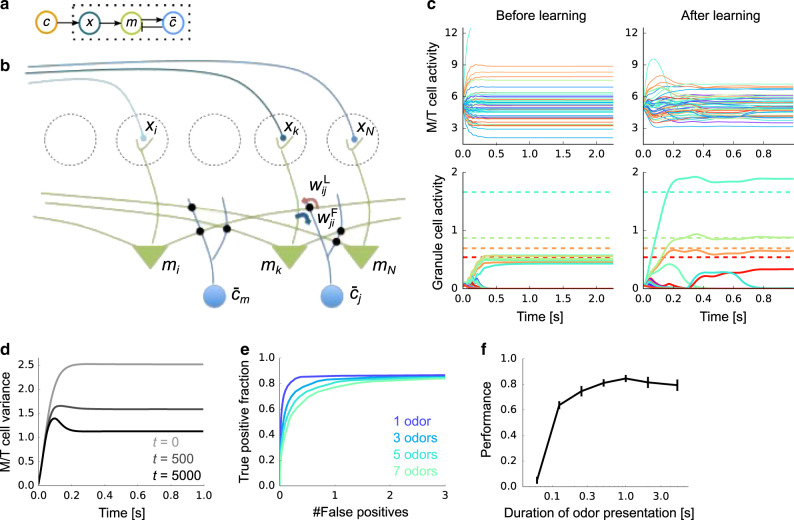
Fig. 3. Neural implementation of Bayesian learning.
a Schematic of the neural architecture. Dotted box represents the internal variables of the brain; the odor, c, comes from the outside world. b The neural implementation of our Bayesian learning model maps almost perfectly onto the circuitry of the olfactory bulb. Dotted circles are glomeruli, green triangles are M/T cells, and blue circles represent olfactory granule cells. Red and blue arrows indicate weights from granule to M/T and M/T to granule cells, respectively. c An example of firing rate dynamics before (left) and after (right) learning (M = 50 odors, N = 400 glomeruli, four odors presented). Different colors represent different neurons. Dotted horizontal lines in the bottom figures represent the true concentration of the presented odors. d Change in the variance of M/T cells during learning (t: trial). The expectation was taken over both population and trials. e Receiver operating characteristic (ROC) curves under different numbers of simultaneously presented odors (M = 100 odors, N = 400 glomeruli). See subsection “ROC curve” in the Methods section for details. f Performance under learning from various odor exposure duration (see subsection “Performance evaluation” in the Methods section), where M = 100, N = 400, and three odors are presented simultaneously, on average. The lines and their error bars are mean and standard deviation over 10 simulations.

