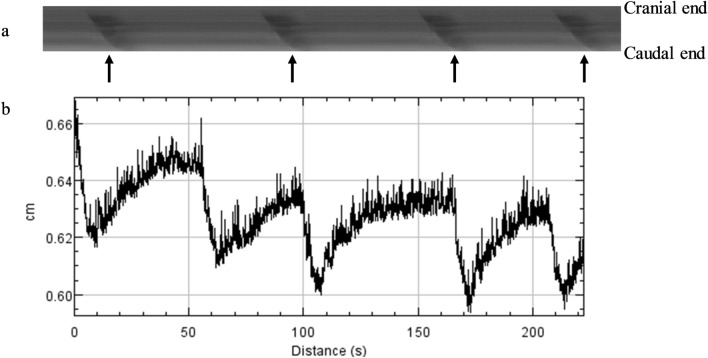
Figure 2.
Example of spatiotemporal maps generated through the ImageJ software (version 1.51q; NIH, Bethesda, MD, USA, 2017) with the DMapLE plug-in (developed by Dr. Sean Parsons and freely available at https://scepticalphysiologist.com/code/code.html) for recordings of cecal contractions in laying hens. Maps display the diameter across the cecum from the cranial to caudal end vertically (cm) and over time (s) horizontally. The diameter of the gut is displayed as bands of light (relaxation; larger diameter) and dark (contraction; smaller diameter) hues (a). In the current example, four contractions running from the cranial to the caudal end can be observed (indicated with arrows). Velocity is determined by measuring the slope of contraction, frequency as the number of contractions within a given time period, and amplitude as the height of the diameter change at peak contraction (a). Note that these are examples and therefore the bands in a do not correspond to the peaks in (b).

