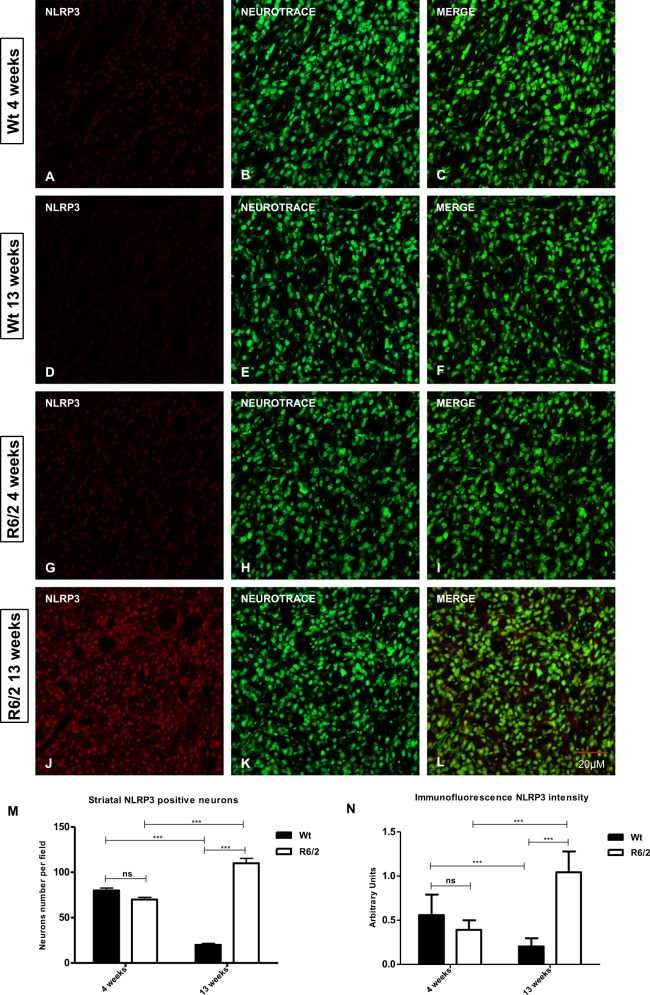
Fig. 2. NLRP3 immunostaining in striatal neurons.
NLRP3 is showed in red fluorescence, Nissl-like fluorescent marker Neurotrace visualized in green. a–l Immunoreaction intensity of NLRP3 in each animal group at the different time points. Two-way ANOVA analysis performed on data obtained by 4 and 13 weeks old Wt and 4 and 13 weeks old R6/2 mice showed a statistically significant effect of Genotype (F1,36 = 108,9; P < 0.001), Time (F1,36 = 20.00; P < 0.001) and Genotype X Time Interaction (F1,36 = 268,9; P < 0.001) of NLRP3 positive striatal neurons. m, n Histogram shows NLRP3 intensity quantification, that is significantly increased in the striatal neurons of 13 week-old R6/2 mice [Genotype effect F1,36 = 34,96; P < 0.001; Time effect F1,36 = 6,830; P < 0.05; Genotype X Time Interection F1,36 = 78,04; P < 0.001].

