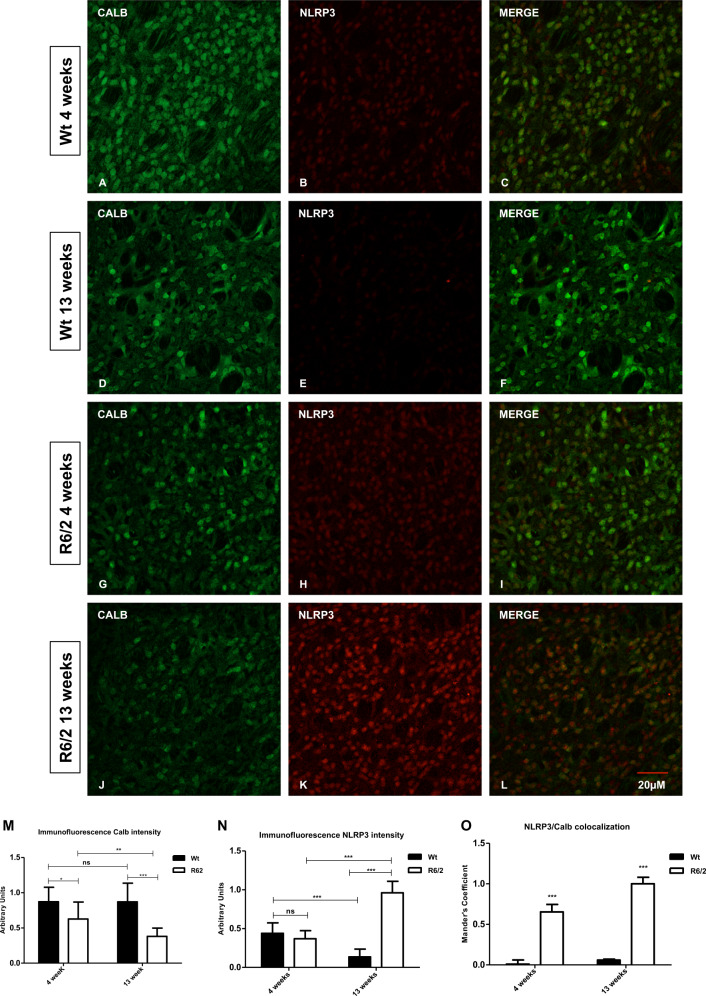
Fig. 4. NLRP3 distribution in striatal projection neurons.
Confocal microscopy-acquired images of double-label immunofluorescence for Calbindin and NLRP3. Calbindin is showed in green fluorescence, NLRP3 is labelled in red. a–l Images show the immunoreaction intensity of Calbindin and NLRP3 in each experimental group. Calbindin positive neurons and intensity were dramatically decreased in projection neurons of 13 weeks old R6/2 mice F1,36 = 27,57; p < 0.001. m, n Two way ANOVA analysis performed on data obtained by 4 and 13 weeks old Wt and 4 and 13 weeks old R6/2 mice showed a statistically significant effect of Genotype (F1,36 = 108,9; P < 0.001), Time (F1,36 = 20.00; P < 0.001) and GenotypeXTime Interection (F1,36 = 268,9; P < 0.001) on NLRP3 positive striatal neurons. o Quantitative analysis of coexpression levels by Mander’s coefficient in all experimental groups. Histogram represented the mean of ROIs calculated Mander’s coefficients revealed the statistically significant colocalization of NLRP3 in Calbindin positive neurons P < 0.001.

