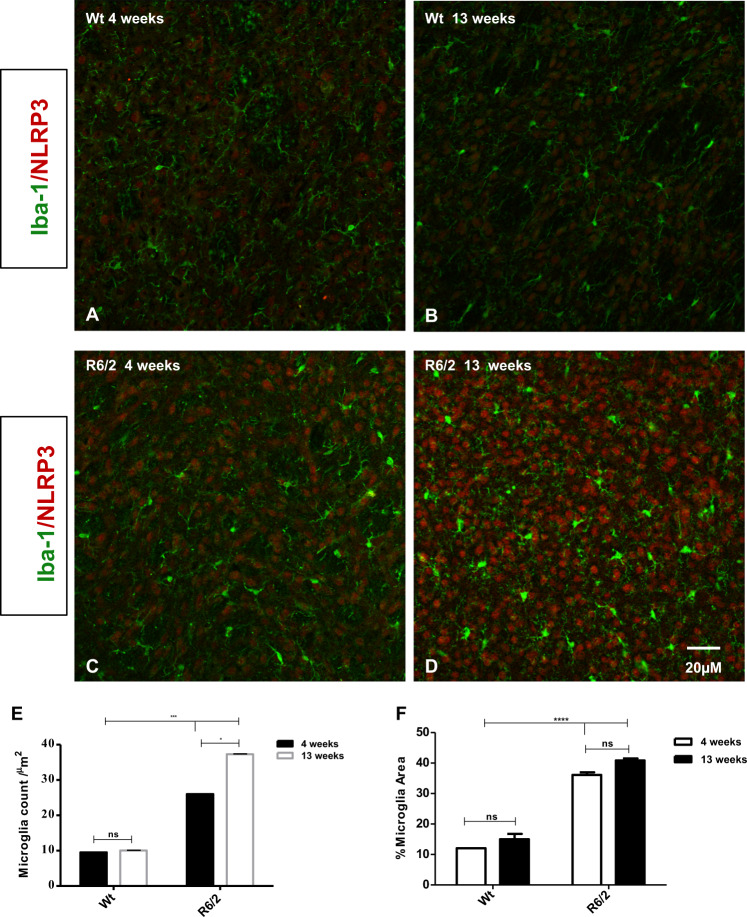
Fig. 6. Distribution analysis of microglia (Iba-1) and NLRP3 in the striatum mice.
Representative confocal images showing the distribution of microglia in the four experimental animal groups (a–d). e Statistical analysis (T-test) showed that Iba-1 positive cells increased significantly in the 4- and 13 week-old R6/2 mice compared to Wt at 4- and 13 weeks of age F(1,36) = 88,17 P < 0.001, correlating with the statistically significant expression levels of NLRP3. f Significant increase of microglial cells area in the 4- and 13 week-old R6/2 mice compared to Wt at the 2 different time point [Genotype effect F(1,36) = 5590; P < 0.001; Time effect F(1,36) = 132.5; P < 0.001].

