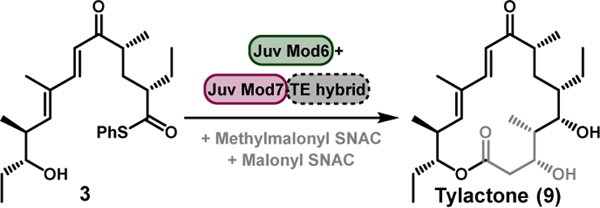
Table 3.
Reaction of 3 with Juv Mod6 + Juv Mod7 TE hybrids.[a]
 | ||
|---|---|---|
| Module | TE | Conversion to 9 (%) |
 |
 |
30 ± 0.8 |
 |
34 ± 3.3 | |
 |
trace | |
Conversion to 9 was monitored by HPLC with data represented as the mean ± standard deviation where n = 3. Trace=detected by LC-MS but below the detection limit of HPLC.
